
The Edge of Chaos
Complex systems made of many copying, interacting parts can sit near a critical edge, the narrow band between order and chaos. There, small shocks cascade, large events need no large cause, and the calm itself can be a warning. This series builds that idea step by step from simple models, then turns it on markets, flows, and risk management.
On the image Haeckel drew thousands of forms that come out of a few simple rules of growth. This series is about systems of many simple parts that organise themselves. Diatomea, plate 4 of Ernst Haeckel’s Kunstformen der Natur, 1904. Public domain, via Wikimedia Commons.
Some of the most important things markets do look impossible on paper. They crash on days with no news big enough to blame, they go quietest right before they break, and a handful of enormous moves carry most of the risk, dwarfing the ordinary ones. The bell curve says none of that should happen, so for a long time it got waved away as bad luck or news we must have missed.
Bad luck is the wrong frame. This is what a system does when it is built from many parts that copy and lean on each other. Drive a system like that and it tends to settle in the narrow band between order and chaos, where a small shock can run away and the quiet is really just the system loading up for the next slide. This series builds that idea from the simplest models I could find, with a lot of pictures, and then turns it loose on markets.
It runs in eight steps, one per essay:
- Phase transitions. A crowd copying its neighbors can swing its whole mood with no trigger to match.
- Self-organization. Nobody sets the dial; the system finds the edge on its own.
- Bubble signatures. When feedback runs faster than exponential, some crashes show their hand on the way up.
- Reflexivity. A trick borrowed from earthquake science measures how much a market is just reacting to itself.
- Inelastic markets. Gabaix and Koijen’s flow multiplier shows how strongly prices move when money hits a thin aggregate demand curve.
- Warning signs. Why the calm before a break is not safety, and what it quietly gives away.
- The limits. Taleb’s objection, the honest check on all of it: the number you most need, how close the edge is, is the one fat tails hide best.
- Endogenous risk. Daníelsson’s institutional warning: when everyone uses the same risk model, the model can become part of the cascade.
Read it as a map, not a trading system. Bouchaud, Sornette, Bak, Scheffer, Gabaix, Minsky, Taleb, and Daníelsson are all circling the same territory from different sides, not always by the same mechanism, and the lesson they share is plain enough: measure what you can, and build for the cascades you will not see coming in time.
Each essay ends with a toolkit box recording the dials and formulas it added, and the toolkit page collects all of them in one place for rereading.
The simulations built for this series are collected in Explore, each with the question it answers and what it assumes: the feedback and cascade models from the first five essays, and the detection models from the last three.
Reference
Every dial, formula, and warning light from the series, on one page.
Episodes
-

Episode 1: Crashes Without a Cause: Markets as Phase Transitions
Big market moves often show up with no news to explain them. A hundred-year-old model of magnets shows why. When people copy each other strongly enough, a market can hold two moods at once, and the smallest nudge tips it from one to the other. We build the model from scratch, with pictures, then turn it on markets.
-
Episode 2: Sandpiles and Crashes: How Systems Tune Themselves to the Brink
The last essay left a loose end. Markets can sit near a critical edge where small shocks cascade, but critical points are usually finely tuned, so who keeps a market balanced there? The answer, found in a pile of sand, is that nobody does. Some systems walk to the brink on their own, and that is where their crashes come from.
-
Episode 3: Faster Than Exponential: Can You See a Crash Coming?
The last essay said big cascades are built in and the trigger tells you nothing. Didier Sornette disagrees, at least about the biggest ones. He argues a bubble grows faster than exponentially toward a finite-time singularity, leaves a telltale wobble on the way up, and that this makes some crashes partly foreseeable. This is the optimistic case, and its limits.
-
Episode 4: Reflexivity by the Numbers
Everyone agrees markets react to themselves. The question is how much. A statistical tool built for earthquakes turns that vague idea into a single number: the fraction of market activity that is the market reacting to its own moves rather than to outside news. The number turns out to be close to the level where a chain reaction would run away.
-
Episode 5: What Actually Moves Prices
The series has argued that markets move themselves, but there is now a clean mainstream number for that claim. Gabaix and Koijen estimate that one dollar flowing into the stock market raises aggregate market value by about five dollars. Bouchaud ties the same result to microstructure and latent liquidity. Prices are news, flows, and market inelasticity made visible.
-

Episode 6: Why the Calm Is Dangerous
A system heading for a tipping point gives off warning signs in unexpected places. The danger rarely arrives as drama and rising volatility. It hides in the calm. Ecologists learned to read it in lakes and climate, and the same signature shows up before some market crises. This is the measurable cousin of everything in this series.
-
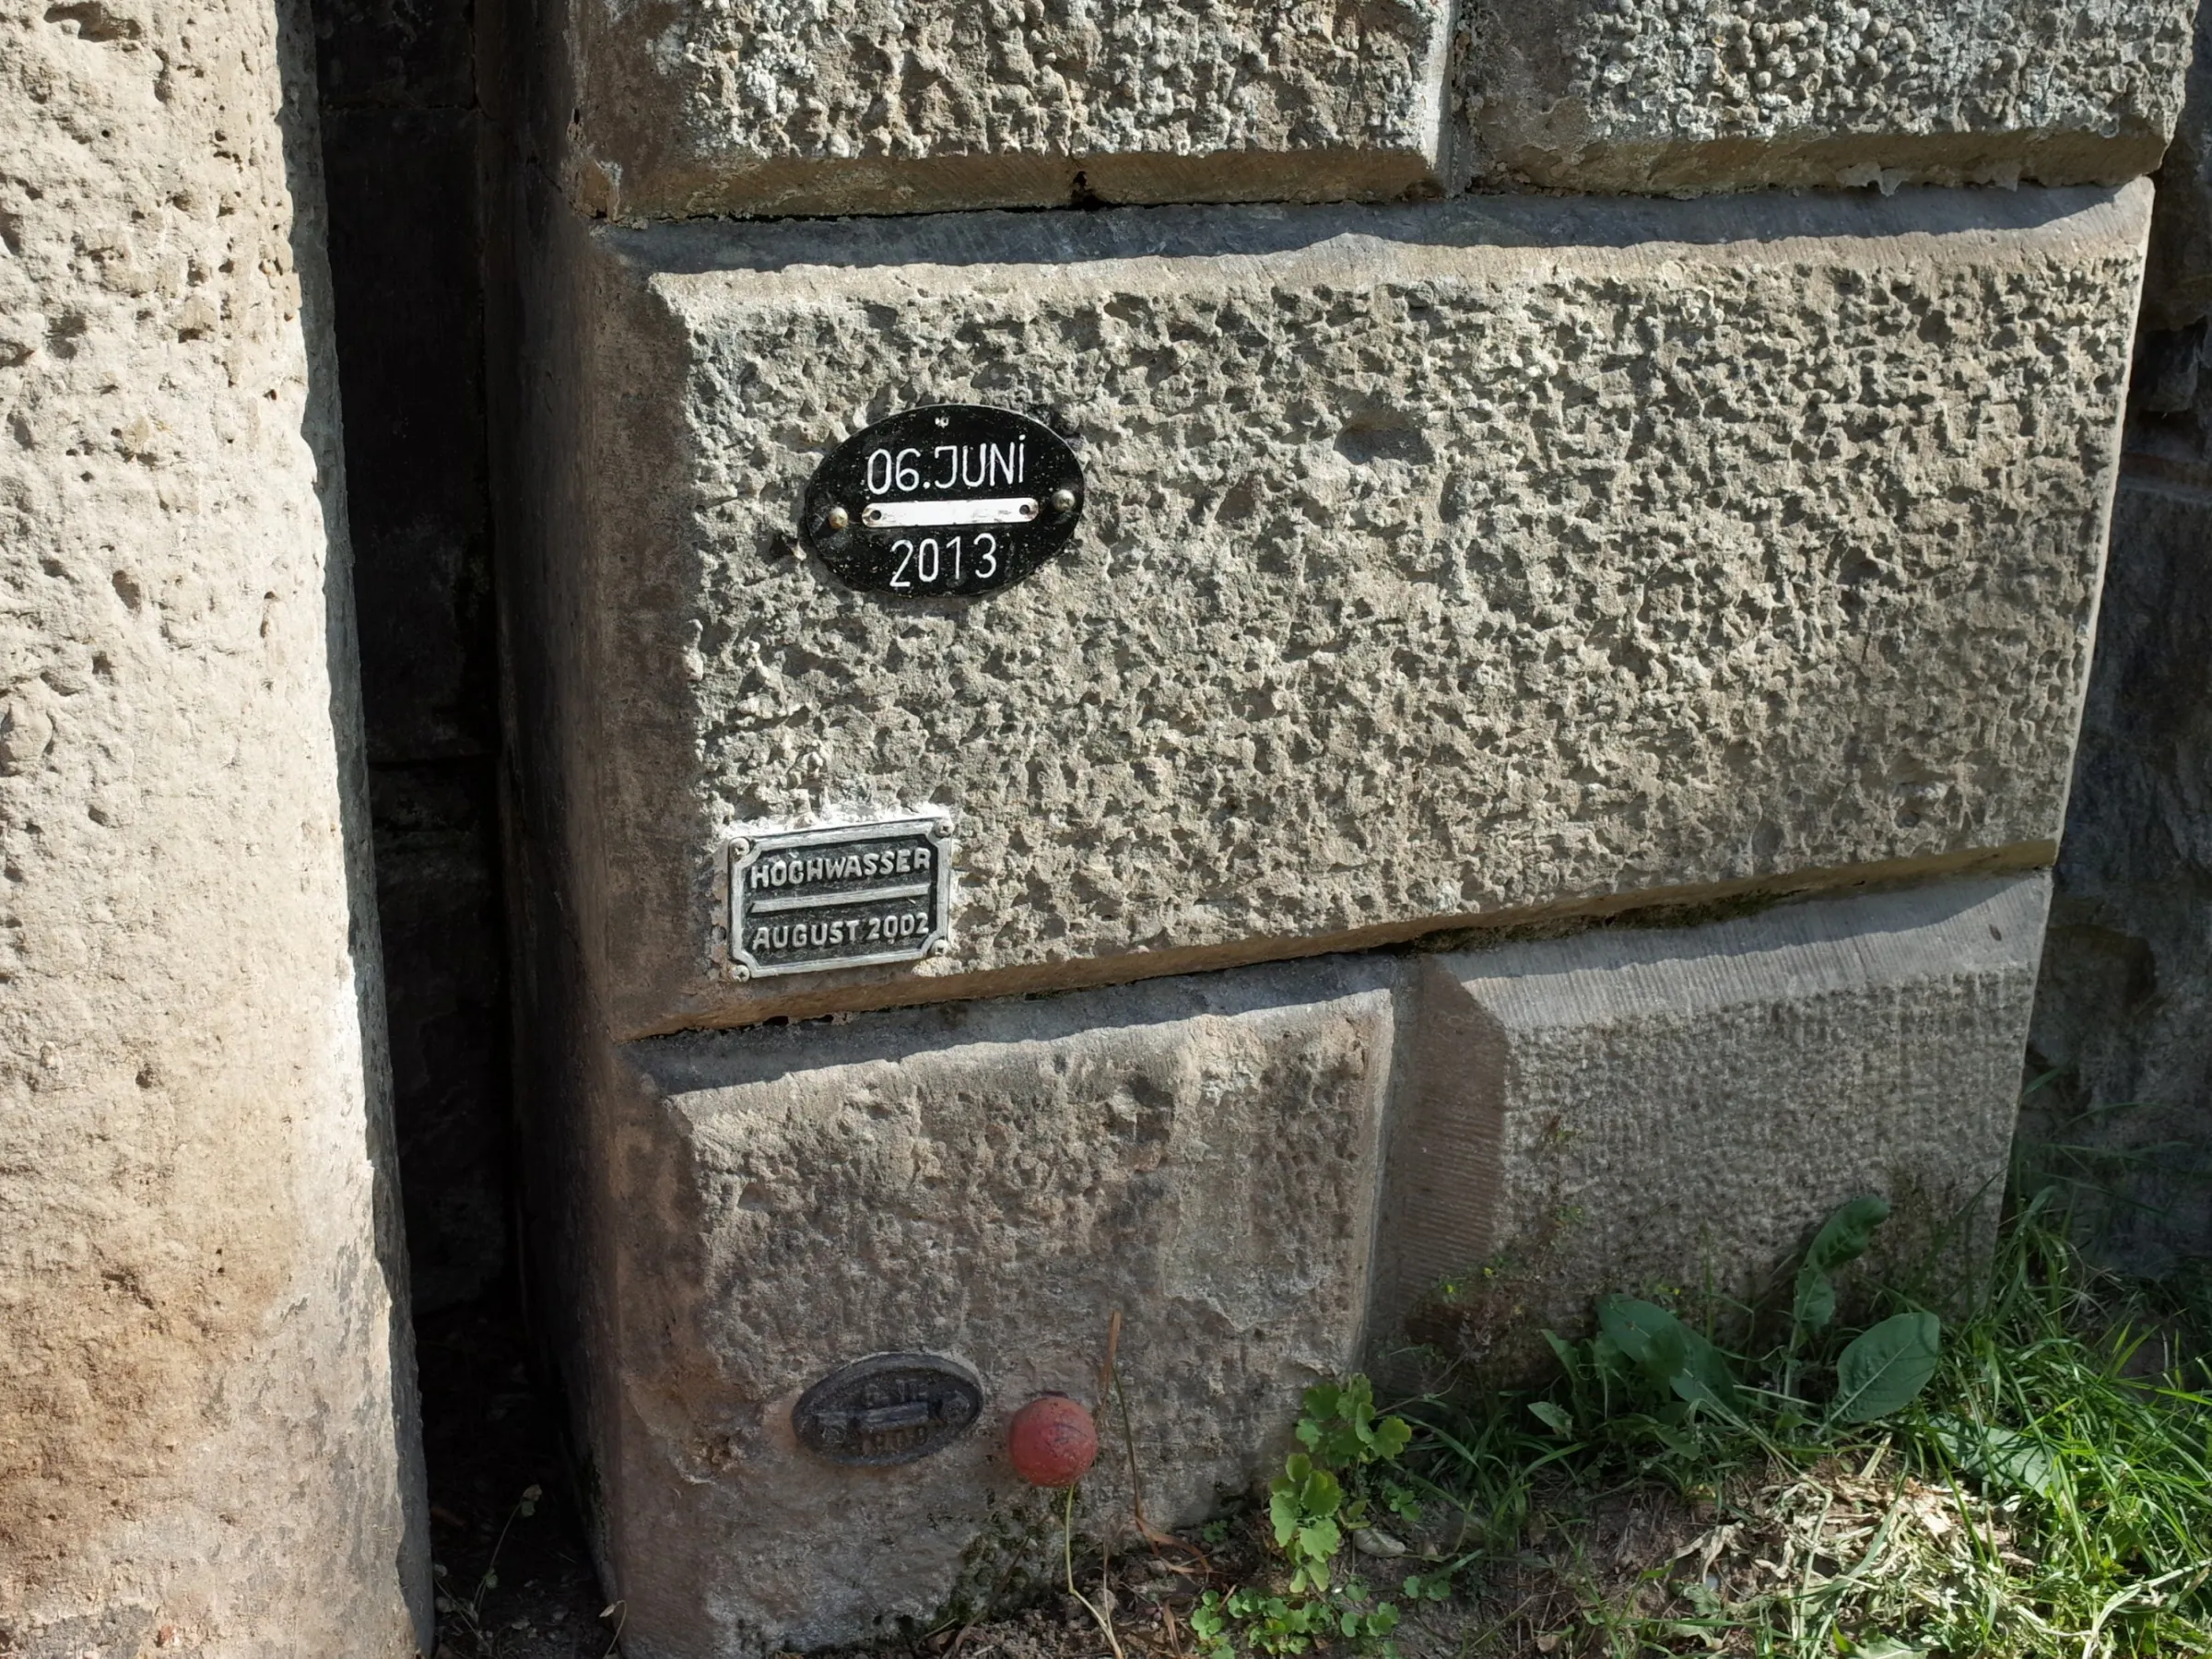
Episode 7: The Limits of Knowing
Every method in this series rests on one number: how close a system sits to its edge. Nassim Taleb spent a career arguing that this is exactly the number you cannot trust. For fat-tailed systems the data needed to pin down the tail converges too slowly, and being honest about your uncertainty fattens the tail further. This is the counterpunch, and where it leaves us.
-
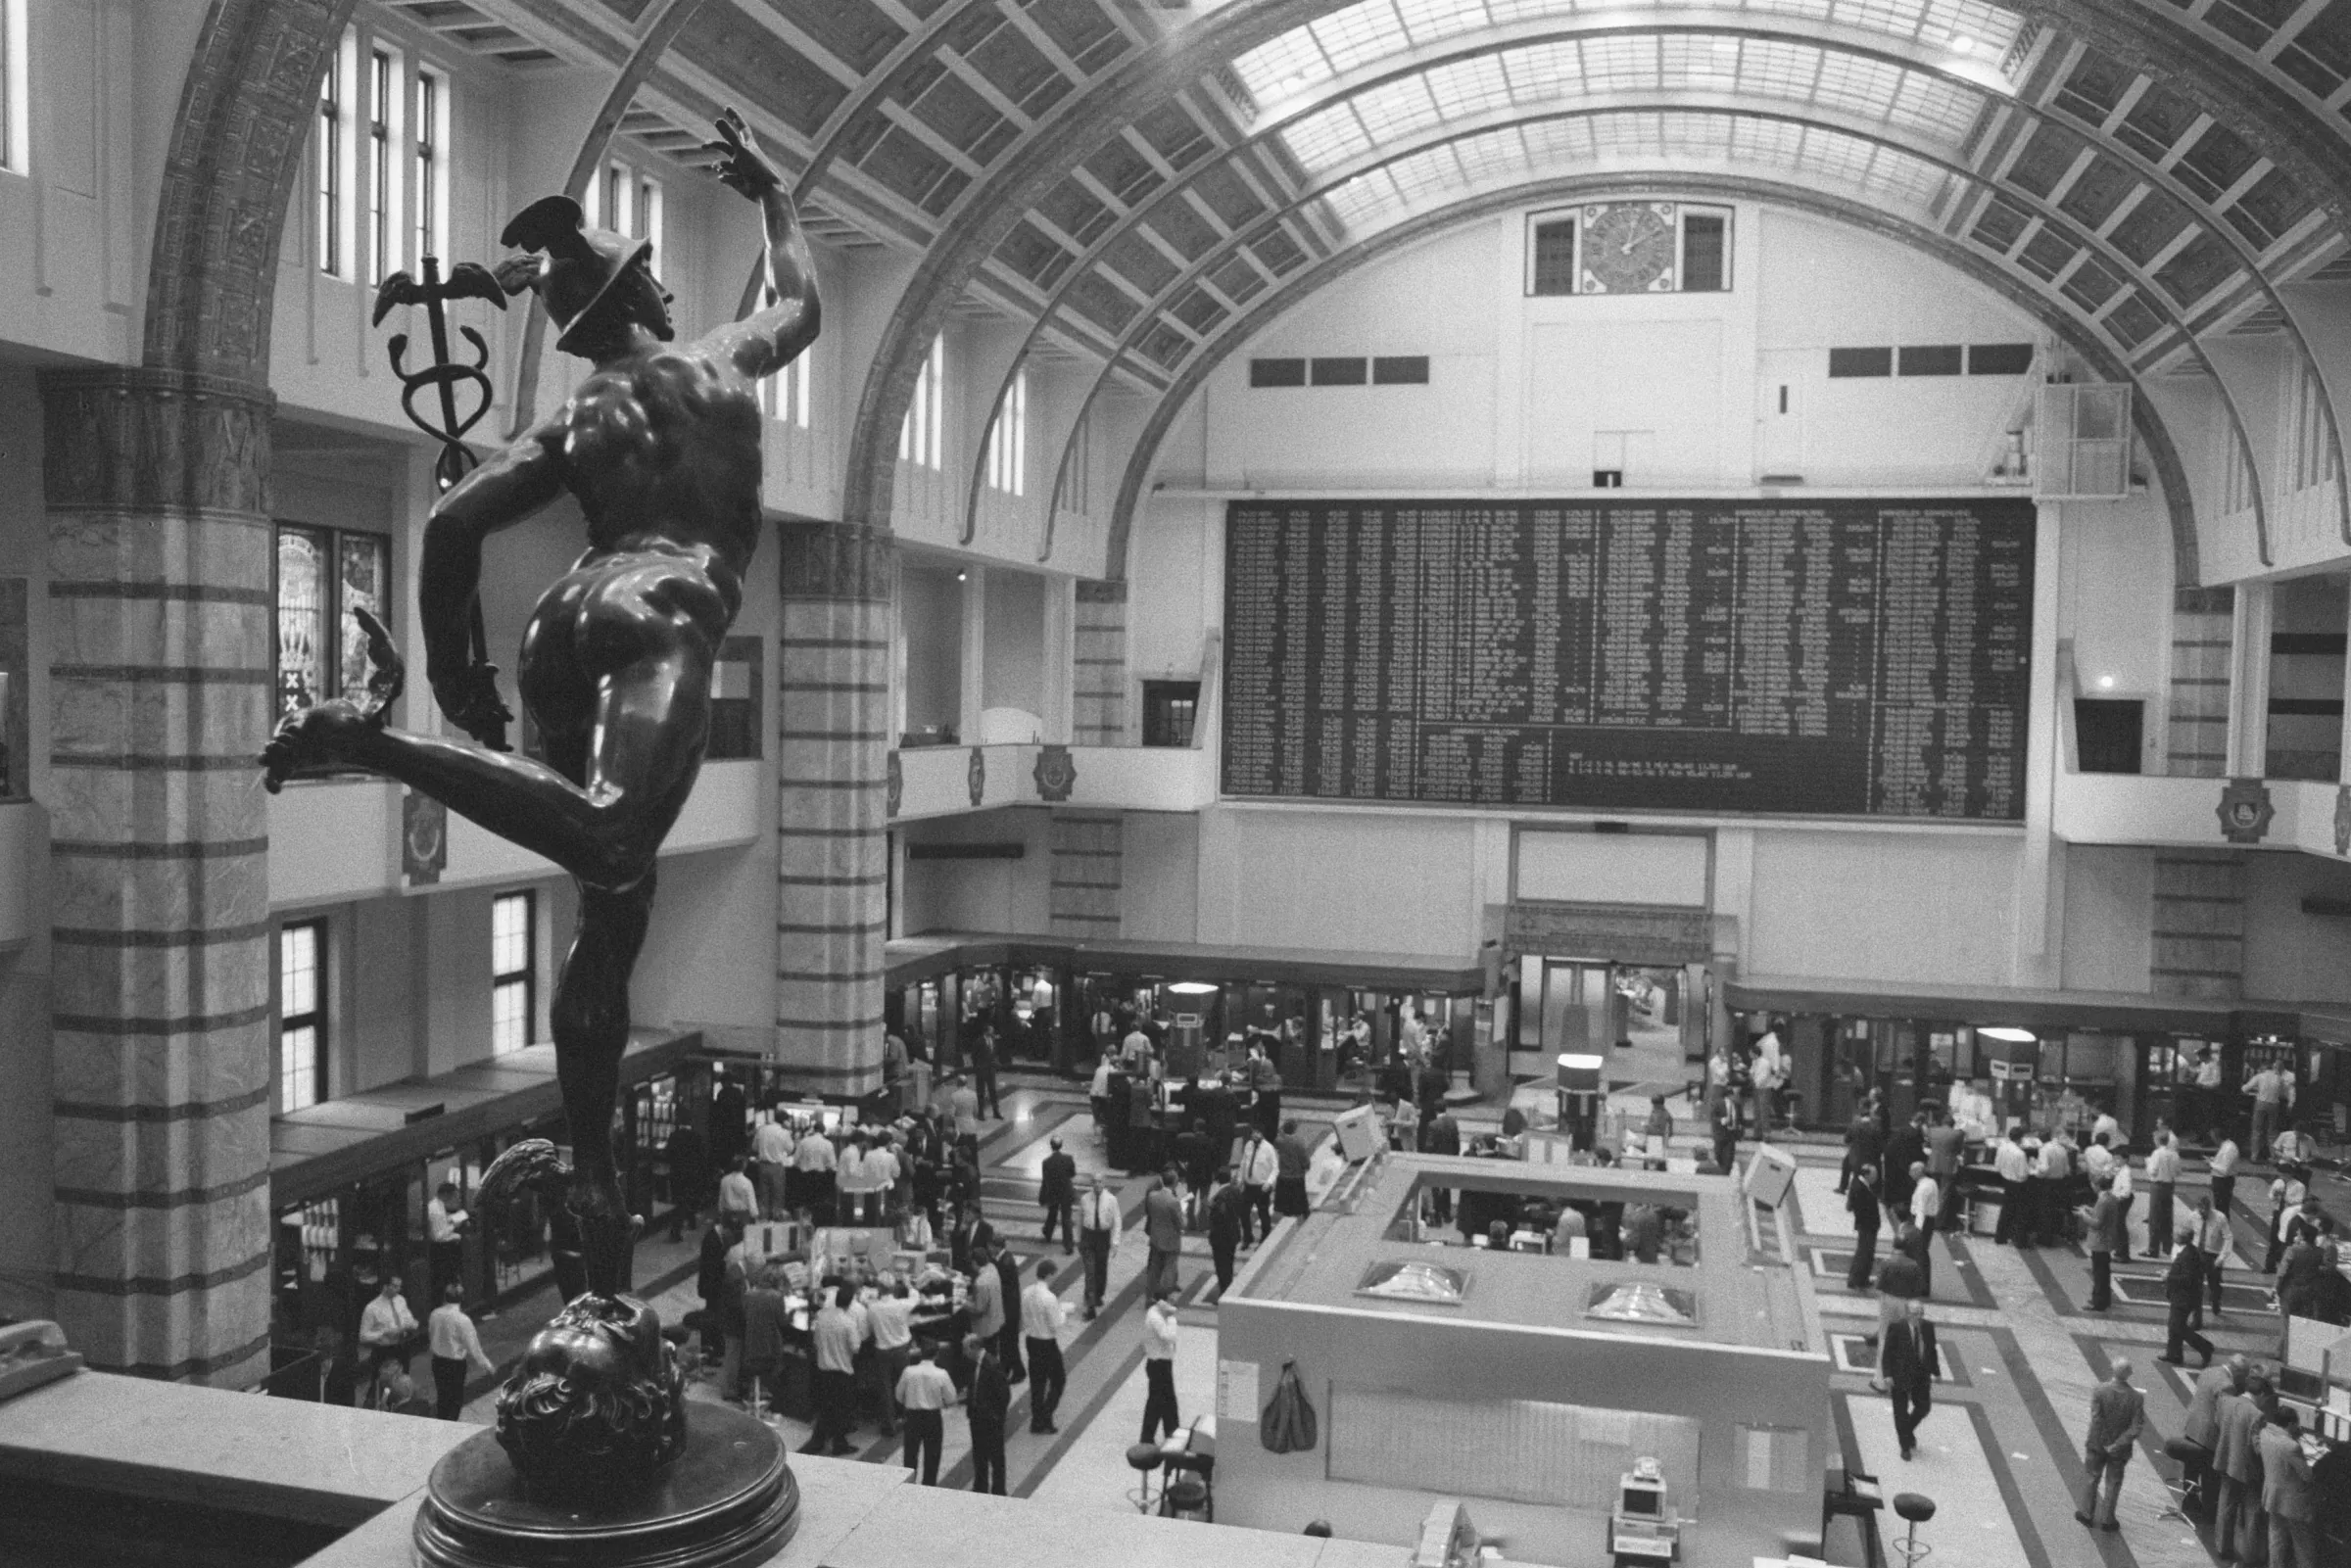
Episode 8: When Risk Models Create Risk
The last essay said the tail is too hard to measure. Jón Daníelsson goes one step further: in finance, the measurement itself changes the thing measured. When everyone uses the same risk model, the model becomes a synchronization device. The answer is a system designed to survive without everyone trusting the same number.
This series is in progress. More episodes are coming.