What Actually Moves Prices
The last essay put a number on reflexivity. A branching ratio near one says the market spends most of its time reacting to itself, with one trade setting off the next. That is already a hard blow to the tidy picture where prices mostly digest outside news.
But there is an even cleaner number, and it comes from mainstream economics rather than econophysics. Xavier Gabaix and Ralph Koijen asked a blunt question: if one dollar flows into the aggregate stock market, how much does the market’s total value rise?
The old intuition says the answer should be close to one dollar, or maybe less. A deep market should absorb flows. Prices should move mostly because expected cash flows, discount rates, or risk premia changed. Buying pressure should be a sideshow.
Their estimate is about five dollars.
That is the most important recent bridge into the whole Edge of Chaos story. The market is an inelastic object, far from the vast ocean of the old intuition. Push it with flows and the whole level moves.
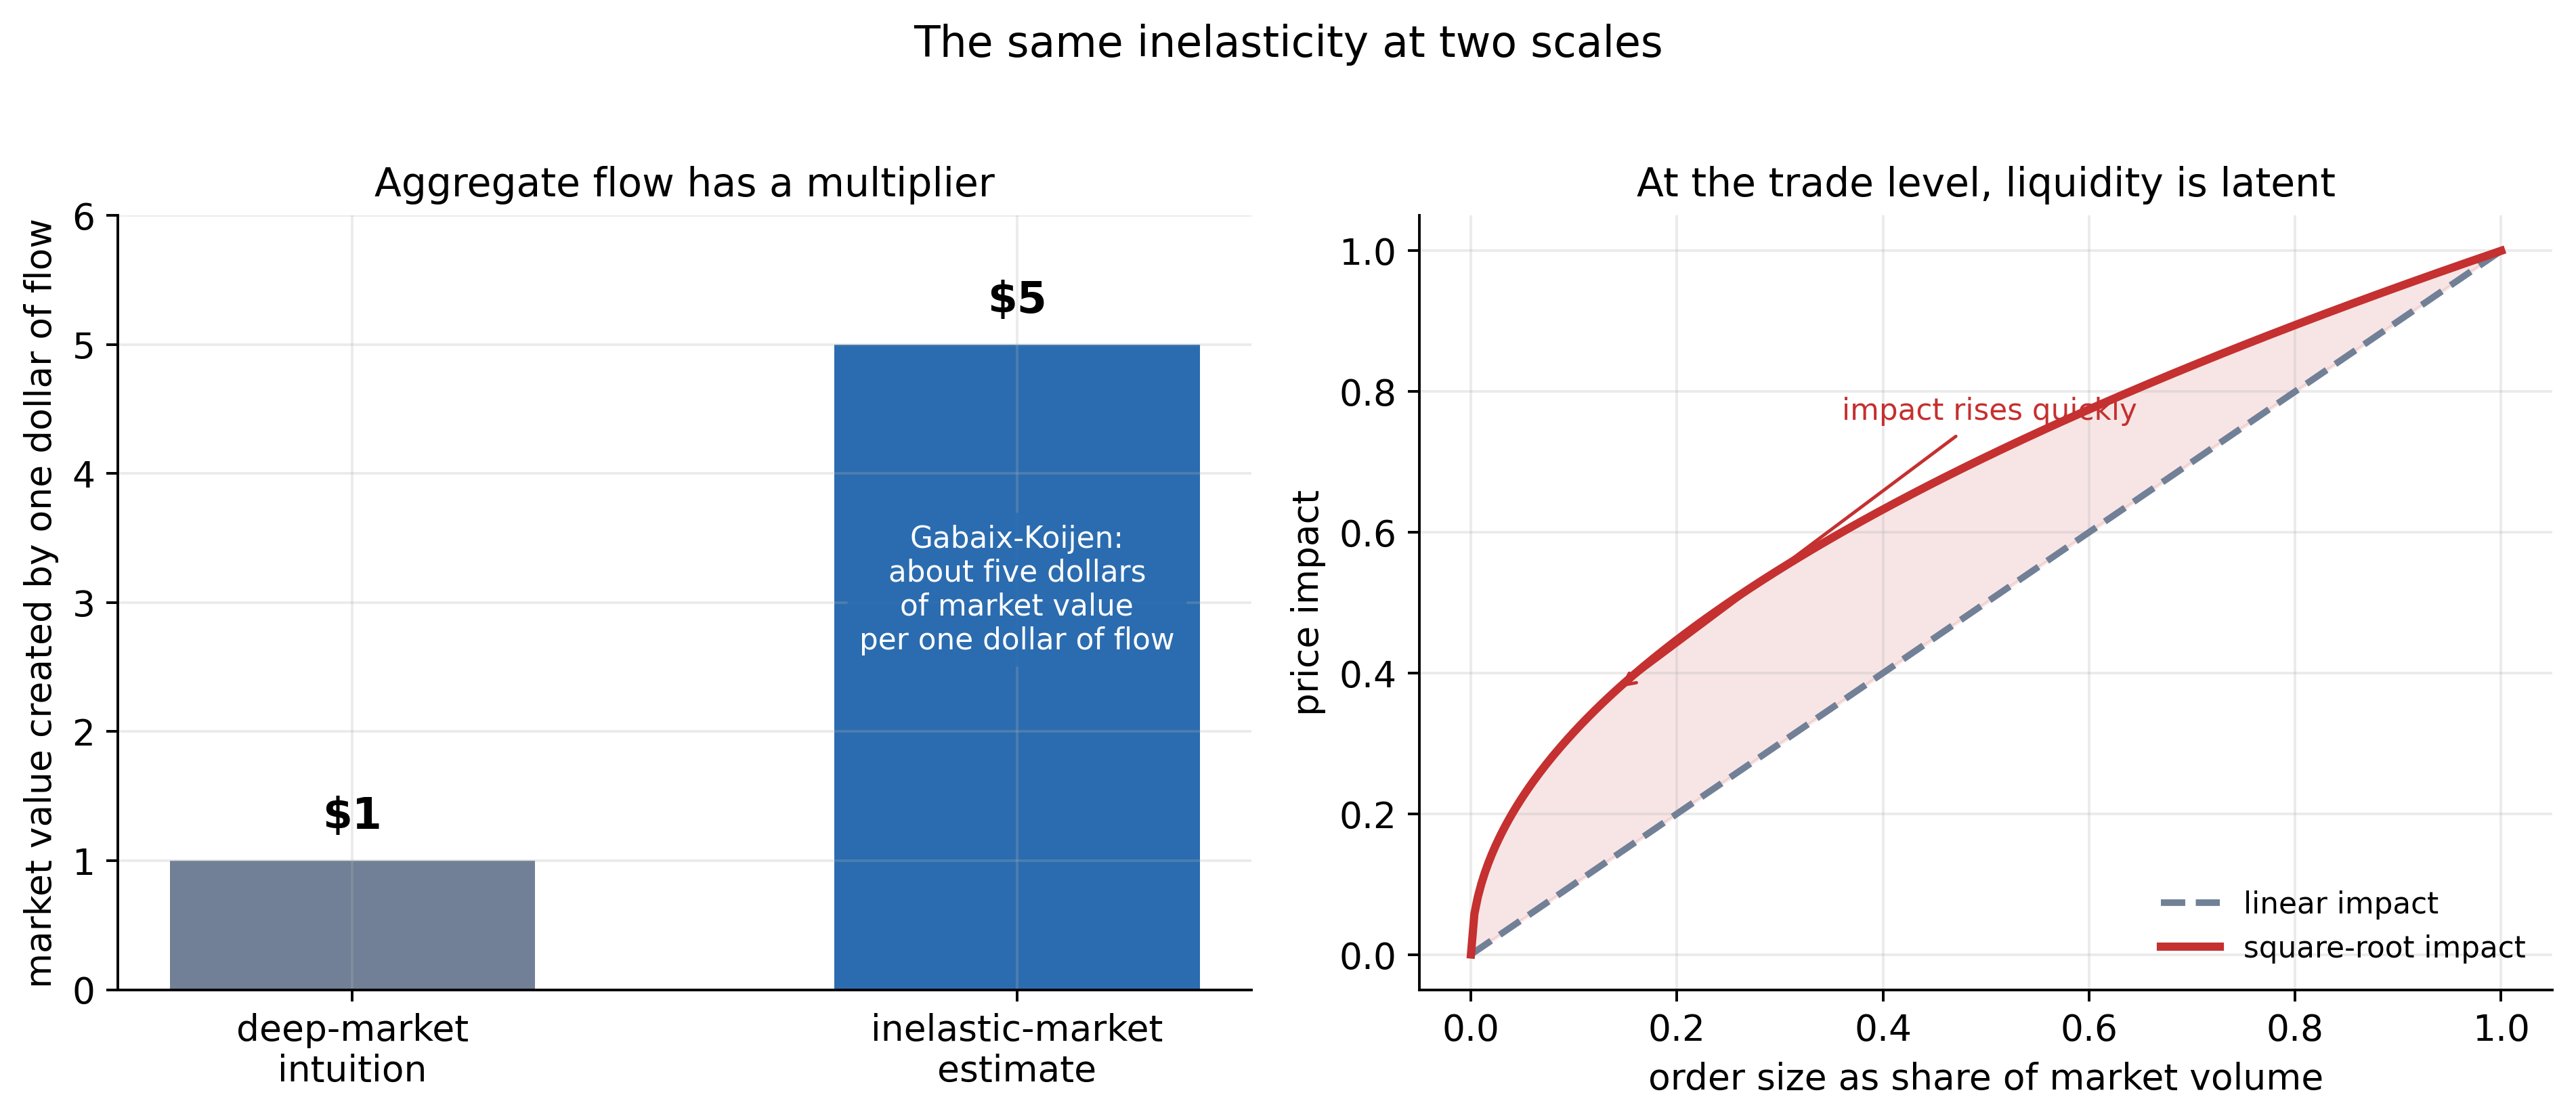
The new macro number and the older microstructure law tell the same story. At the aggregate level, flows have a multiplier. At the trade level, latent liquidity makes impact nonlinear rather than harmless.
#I. The missing lever
Standard finance begins with a comforting picture. Prices move because information arrives. A company reports earnings, rates change, inflation surprises, a war starts, a technology improves. Investors update beliefs, and prices adjust.
That picture has a problem. The biggest price moves often have no news large enough to explain them. We started the series there, with 1987. If prices only reflect fundamentals, a crash without a matching headline is an embarrassment.
The inelastic-markets hypothesis changes the question. Maybe the missing lever is flow rather than hidden news.
Gabaix and Koijen’s argument starts from who actually holds the market. A large share of equity is held by institutions with mandates: index funds, pension funds, insurers, target-date funds, balanced funds, and other allocators whose equity share does not swing freely with every price change. They do not act like infinitely elastic value investors waiting to absorb any flow at almost the same price. Many are constrained, benchmarked, rule-bound, or slow.
If the marginal holders are inelastic, then a flow into equities does not get absorbed quietly. Prices have to move a lot to make the market clear.
That is the one-line result: in aggregate, one dollar of buying can raise market value by about five dollars, with estimates running from roughly three to eight depending on the method. The center of gravity is the same. Flows have a multiplier.
#II. Why this is bigger than “money moves markets”
Every trader already knows flows matter. Gabaix and Koijen turned that intuition into a macro-finance object. They used granular instrumental variables, exploiting the fact that large institutions receive flows for reasons that are partly idiosyncratic to the institution rather than to the whole market. Those flow shocks let them estimate how much the aggregate market moves when money enters or leaves.
That matters because it turns a trading-desk slogan into a parameter. The market’s demand curve has a slope. Its elasticity is low. Aggregate prices are sensitive to who has to buy, who has to sell, and what the news says.
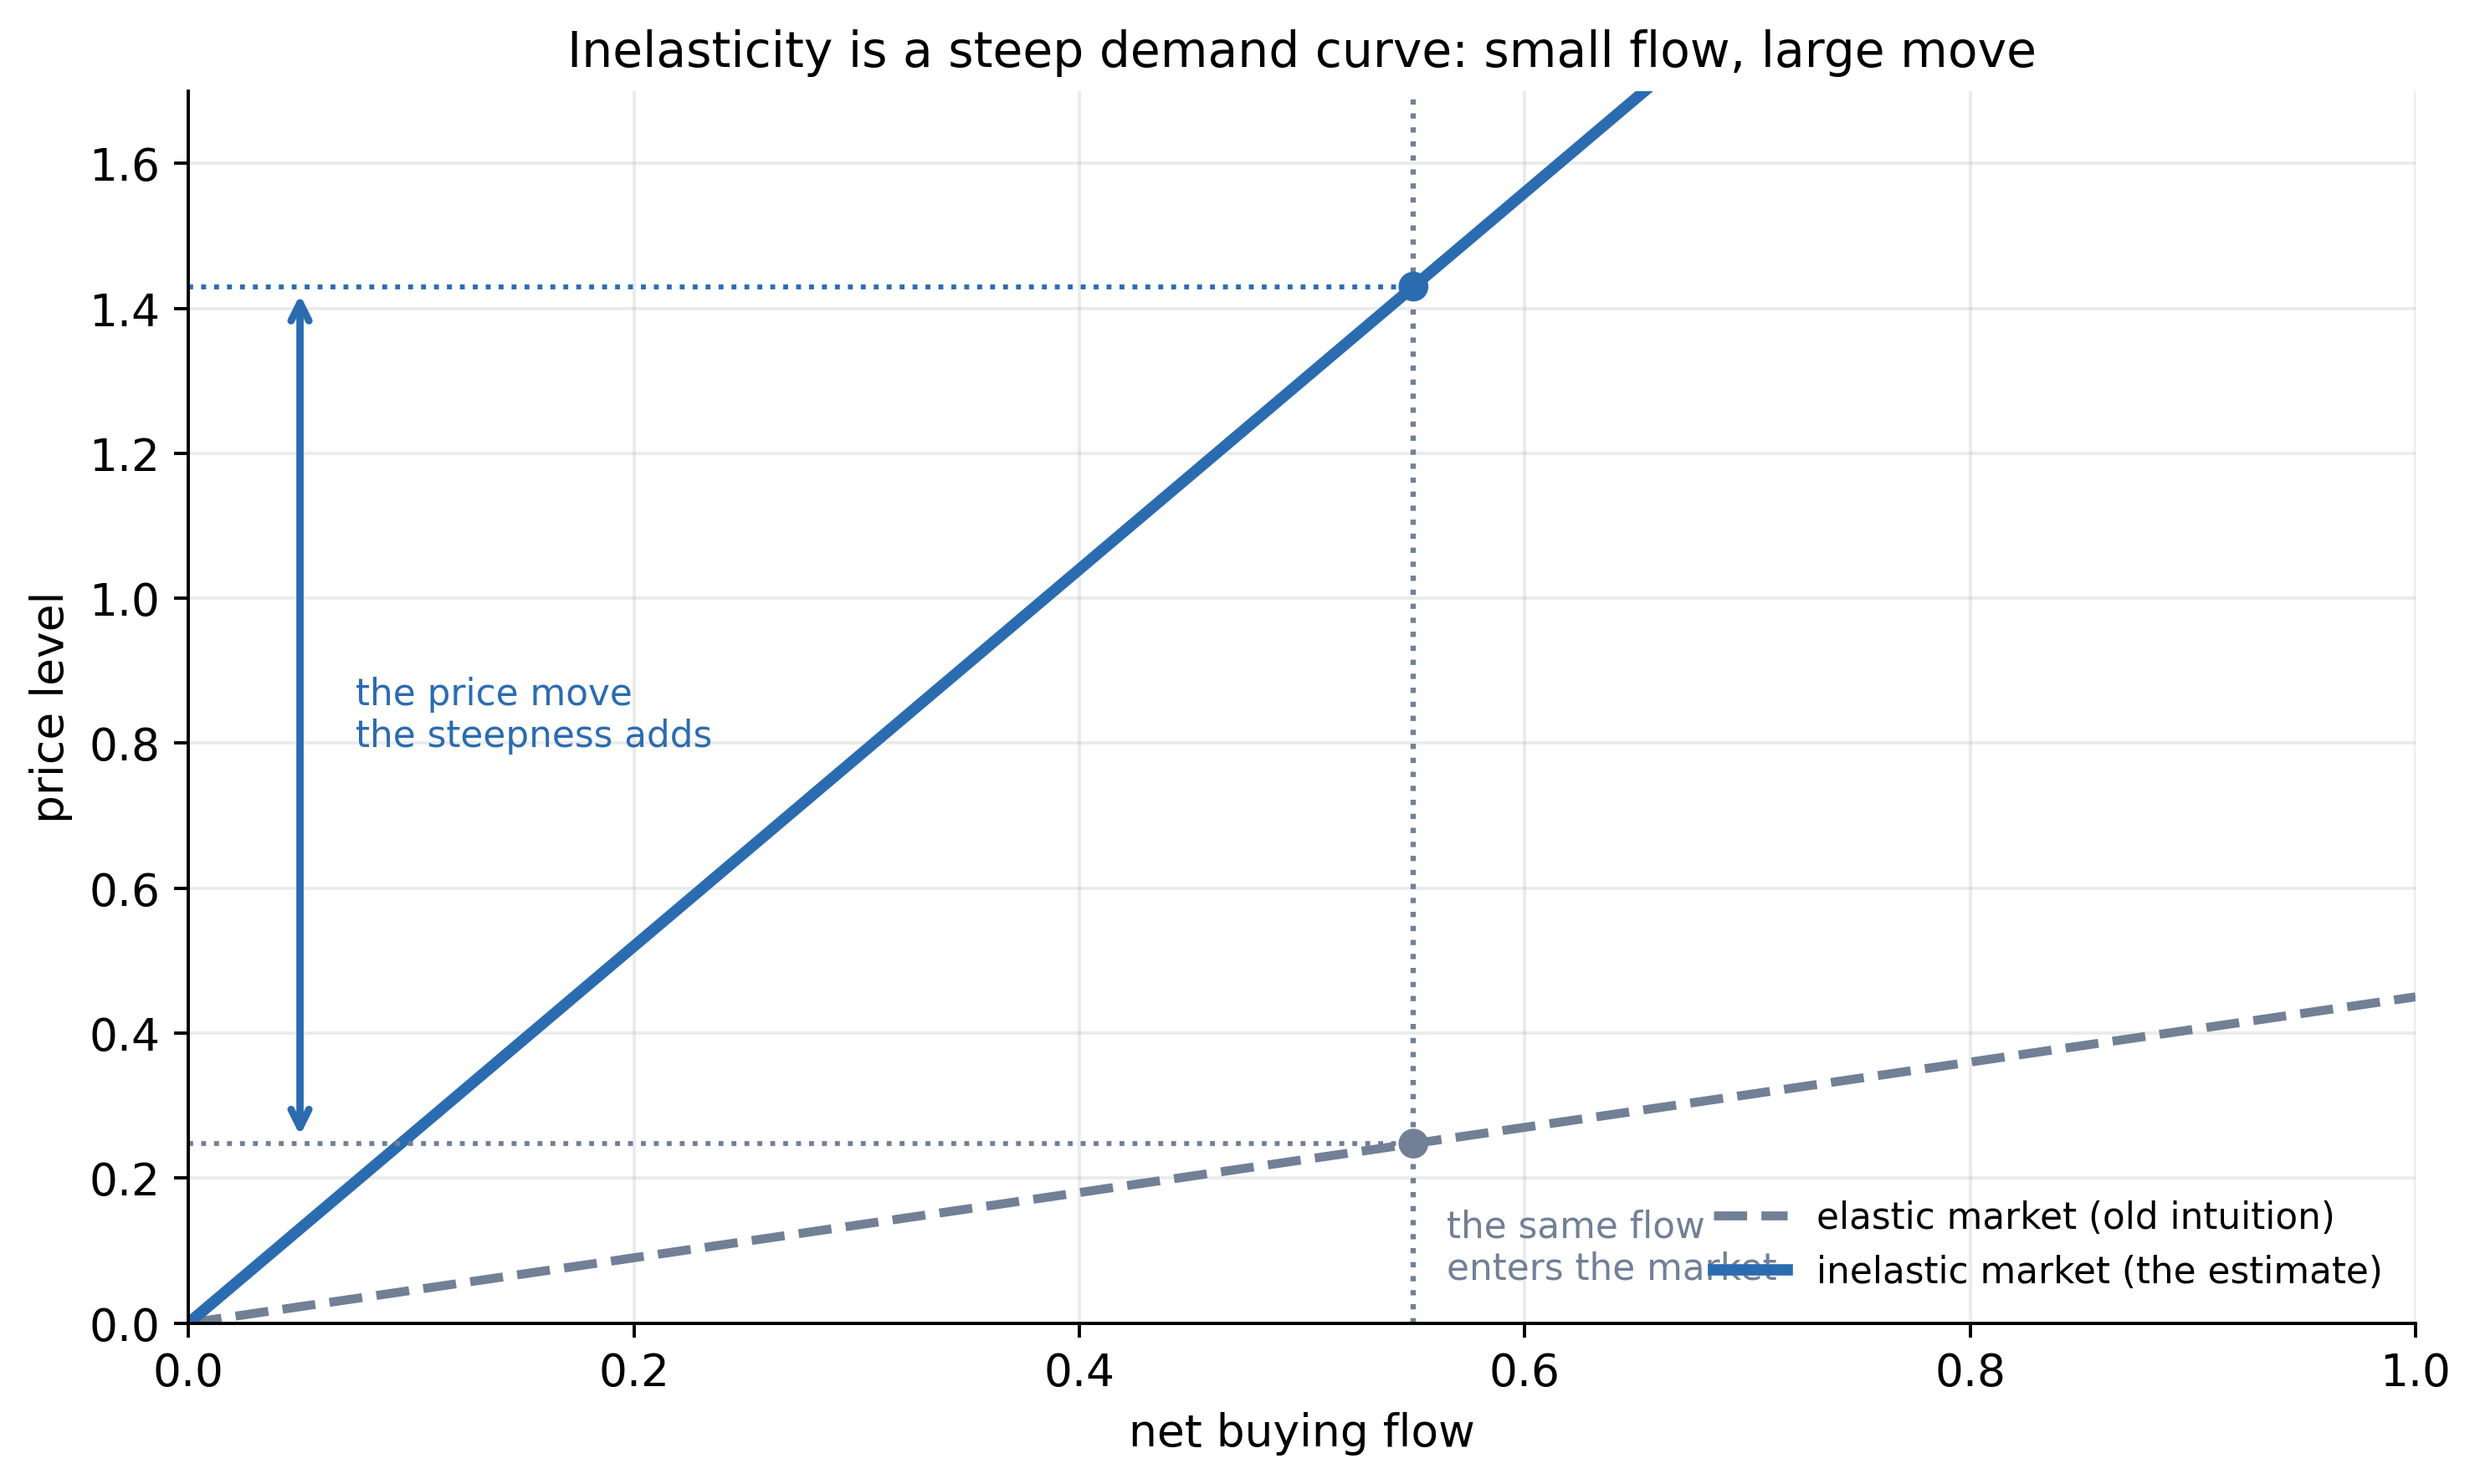
Low elasticity is just a steep demand curve. The same dollar of flow that barely moves a deep market moves an inelastic one by a multiple, because there are not enough willing counterparties to absorb it near the current price.
Move the same idea around directly. Keep the flow fixed and steepen the market, or keep the market fixed and push more flow through it.
This is why the result is bigger than a clever empirical paper. It shifts the ontology of price. A price is not simply the market’s best estimate of discounted fundamentals. It is also the point where constrained balance sheets, mandates, flows, and liquidity meet.
In that world, a price can move because money moved.
#III. Bouchaud connects the scales
Jean-Philippe Bouchaud immediately recognized the shape of the result, because it is the macro version of what market microstructure had been measuring for years.
Guess first: double the size of a large order. Does its price impact double?
At the trade level, large orders move prices in a concave pattern that cannot be reduced to information. A metaorder, one large parent order split into many smaller trades, tends to follow the square-root law of price impact: the price move grows roughly with the square root of the order’s size relative to market volume. Double the order and the impact rises, but less than double.
Bouchaud’s latent-liquidity picture explains why. The visible order book is thin, but the deeper market contains hidden intentions: people willing to buy lower, sell higher, or change their mind as the price moves. Liquidity is latent, adaptive, and fragile rather than a fixed pile sitting there waiting.
His reply to Gabaix and Koijen says the macro multiplier and the micro impact law are not separate facts. They are the same inelasticity seen from different distances. At the small scale, an order walks through latent liquidity and moves the price. At the large scale, institutional flows push against a market whose demand is not elastic enough to absorb them.
The bridge matters. It means the series’ two languages, the physics of interacting agents and the economics of aggregate markets, are describing the same object.
#IV. What this adds to reflexivity
The Hawkes-process essay measured how much markets trigger themselves over time. One event breeds another. Activity clusters. The branching ratio sits near the runaway point.
Inelastic markets measure a different axis: how far prices move when flow arrives. Hawkes gives you the chain reaction. Inelasticity gives you the leverage of each link in the chain.
Put them together and the mechanism is plain. A trade triggers more trades. Those trades hit an inelastic market. Because the market is inelastic, the price moves more than a deep-market story would predict. That price move changes leverage, triggers mechanical rebalancing, and shifts what other strategies are about to do, which sends new flow back into the market.
This is the market doing work on itself. The final essay in the series follows one sharp version of this loop, where the thing that closes it is not the flow but a risk model that everyone is watching at the same time.
It also clarifies why passive and benchmarked capital can have strange system effects. Indexing may be cheap and rational for the individual investor, but at the system level it can reduce the pool of investors willing to lean hard against flows. If more money is managed by rules that mechanically allocate rather than actively absorb dislocations, the aggregate demand curve can steepen. The market becomes easier to push.
That does not make indexing bad. It means the market structure has changed, and the price impact of flows becomes a first-order object.
#V. The practical consequence
The practical lesson leaves fundamentals in the picture.
The lesson is that fundamentals share the job with flows, mandates, rebalancing rules, leverage constraints, dealer balance sheets, and liquidity. Sometimes those forces enter quietly. Sometimes they dominate.
That explains why the same piece of news can produce a small move in one regime and a huge move in another. The news is not the whole cause. It is the grain. The slope is the market’s inelasticity, crowding, leverage, and feedback.
It also explains why “no news” is not the same as “no cause.” A pension rebalance, a volatility-control fund cutting exposure, a dealer hedging options, a fund meeting redemptions, an index inclusion, a margin call, an ETF creation or redemption: these are not headlines about future cash flows, but they are real mechanical forces on price.
If enough of them point the same way, the market moves.
#VI. The new center of gravity
This is why inelastic markets deserve a place in this series. The old heterodox claim was that prices and volatility are driven mostly from inside the market. For years that sounded like physics envy or trader folklore. Gabaix and Koijen gave it a mainstream macro number. Bouchaud connected that number to microstructure.
That convergence is new and important.
The series started with crashes without causes. It then built models where crowds flip, sandpiles avalanche, bubbles accelerate, and trades trigger trades. Inelastic markets add the missing empirical bridge: when flows hit the aggregate market, prices move by a multiple of the flow. The edge is partly a statement about a market whose demand curve is steeper than the old theory allowed.
So the question is no longer “what news moved the market?”
The better question is: what flow hit what liquidity, in what regime, with what feedback waiting behind it?
#Further reading
The macro result:
- Gabaix, X., and Koijen, R. S. J. (2021). In Search of the Origins of Financial Fluctuations: The Inelastic Markets Hypothesis. NBER Working Paper No. 28967.
- Gabaix, X., and Koijen, R. S. J. (2024). Granular Instrumental Variables. Journal of Political Economy, 132(7). The estimation method behind the multiplier.
The microstructure interpretation:
- Bouchaud, J.-P. (2022). The Inelastic Market Hypothesis: A Microstructural Interpretation. Quantitative Finance, 22(10).
The impact-law background:
- Toth, B., Lempérière, Y., Deremble, C., de Lataillade, J., Kockelkoren, J., and Bouchaud, J.-P. (2011). Anomalous Price Impact and the Critical Nature of Liquidity in Financial Markets. Physical Review X, 1.
- Bouchaud, J.-P., Farmer, J. D., and Lillo, F. (2009). How Markets Slowly Digest Changes in Supply and Demand. In Handbook of Financial Markets: Dynamics and Evolution, Elsevier. The canonical review of impact and latent liquidity.
- Bouchaud, J.-P., Bonart, J., Donier, J., and Gould, M. (2018). Trades, Quotes and Prices: Financial Markets Under the Microscope. Cambridge University Press. The book-length treatment of impact and latent liquidity.
- Maitrier, G., Loeper, G., Kanazawa, K., and Bouchaud, J.-P. (2025). The “Double” Square-Root Law: Evidence for the Mechanical Origin of Market Impact. arXiv:2502.16246. Tokyo Stock Exchange data showing impact is mechanical, not informational.
Why arbitrage does not flatten the demand curve:
- Shleifer, A., and Vishny, R. W. (1997). The Limits of Arbitrage. Journal of Finance, 52(1).
Written with an LLM in the loop, like everything here. The ideas and the mistakes are mine. More on how I write.