Faster Than Exponential: Can You See a Crash Coming?
The last essay said big cascades are built in and the trigger tells you nothing. Didier Sornette disagrees, at least about the biggest ones. He argues a bubble grows faster than exponentially toward a finite-time singularity, leaves a telltale wobble on the way up, and that this makes some crashes partly foreseeable. This is the optimistic case, and its limits.
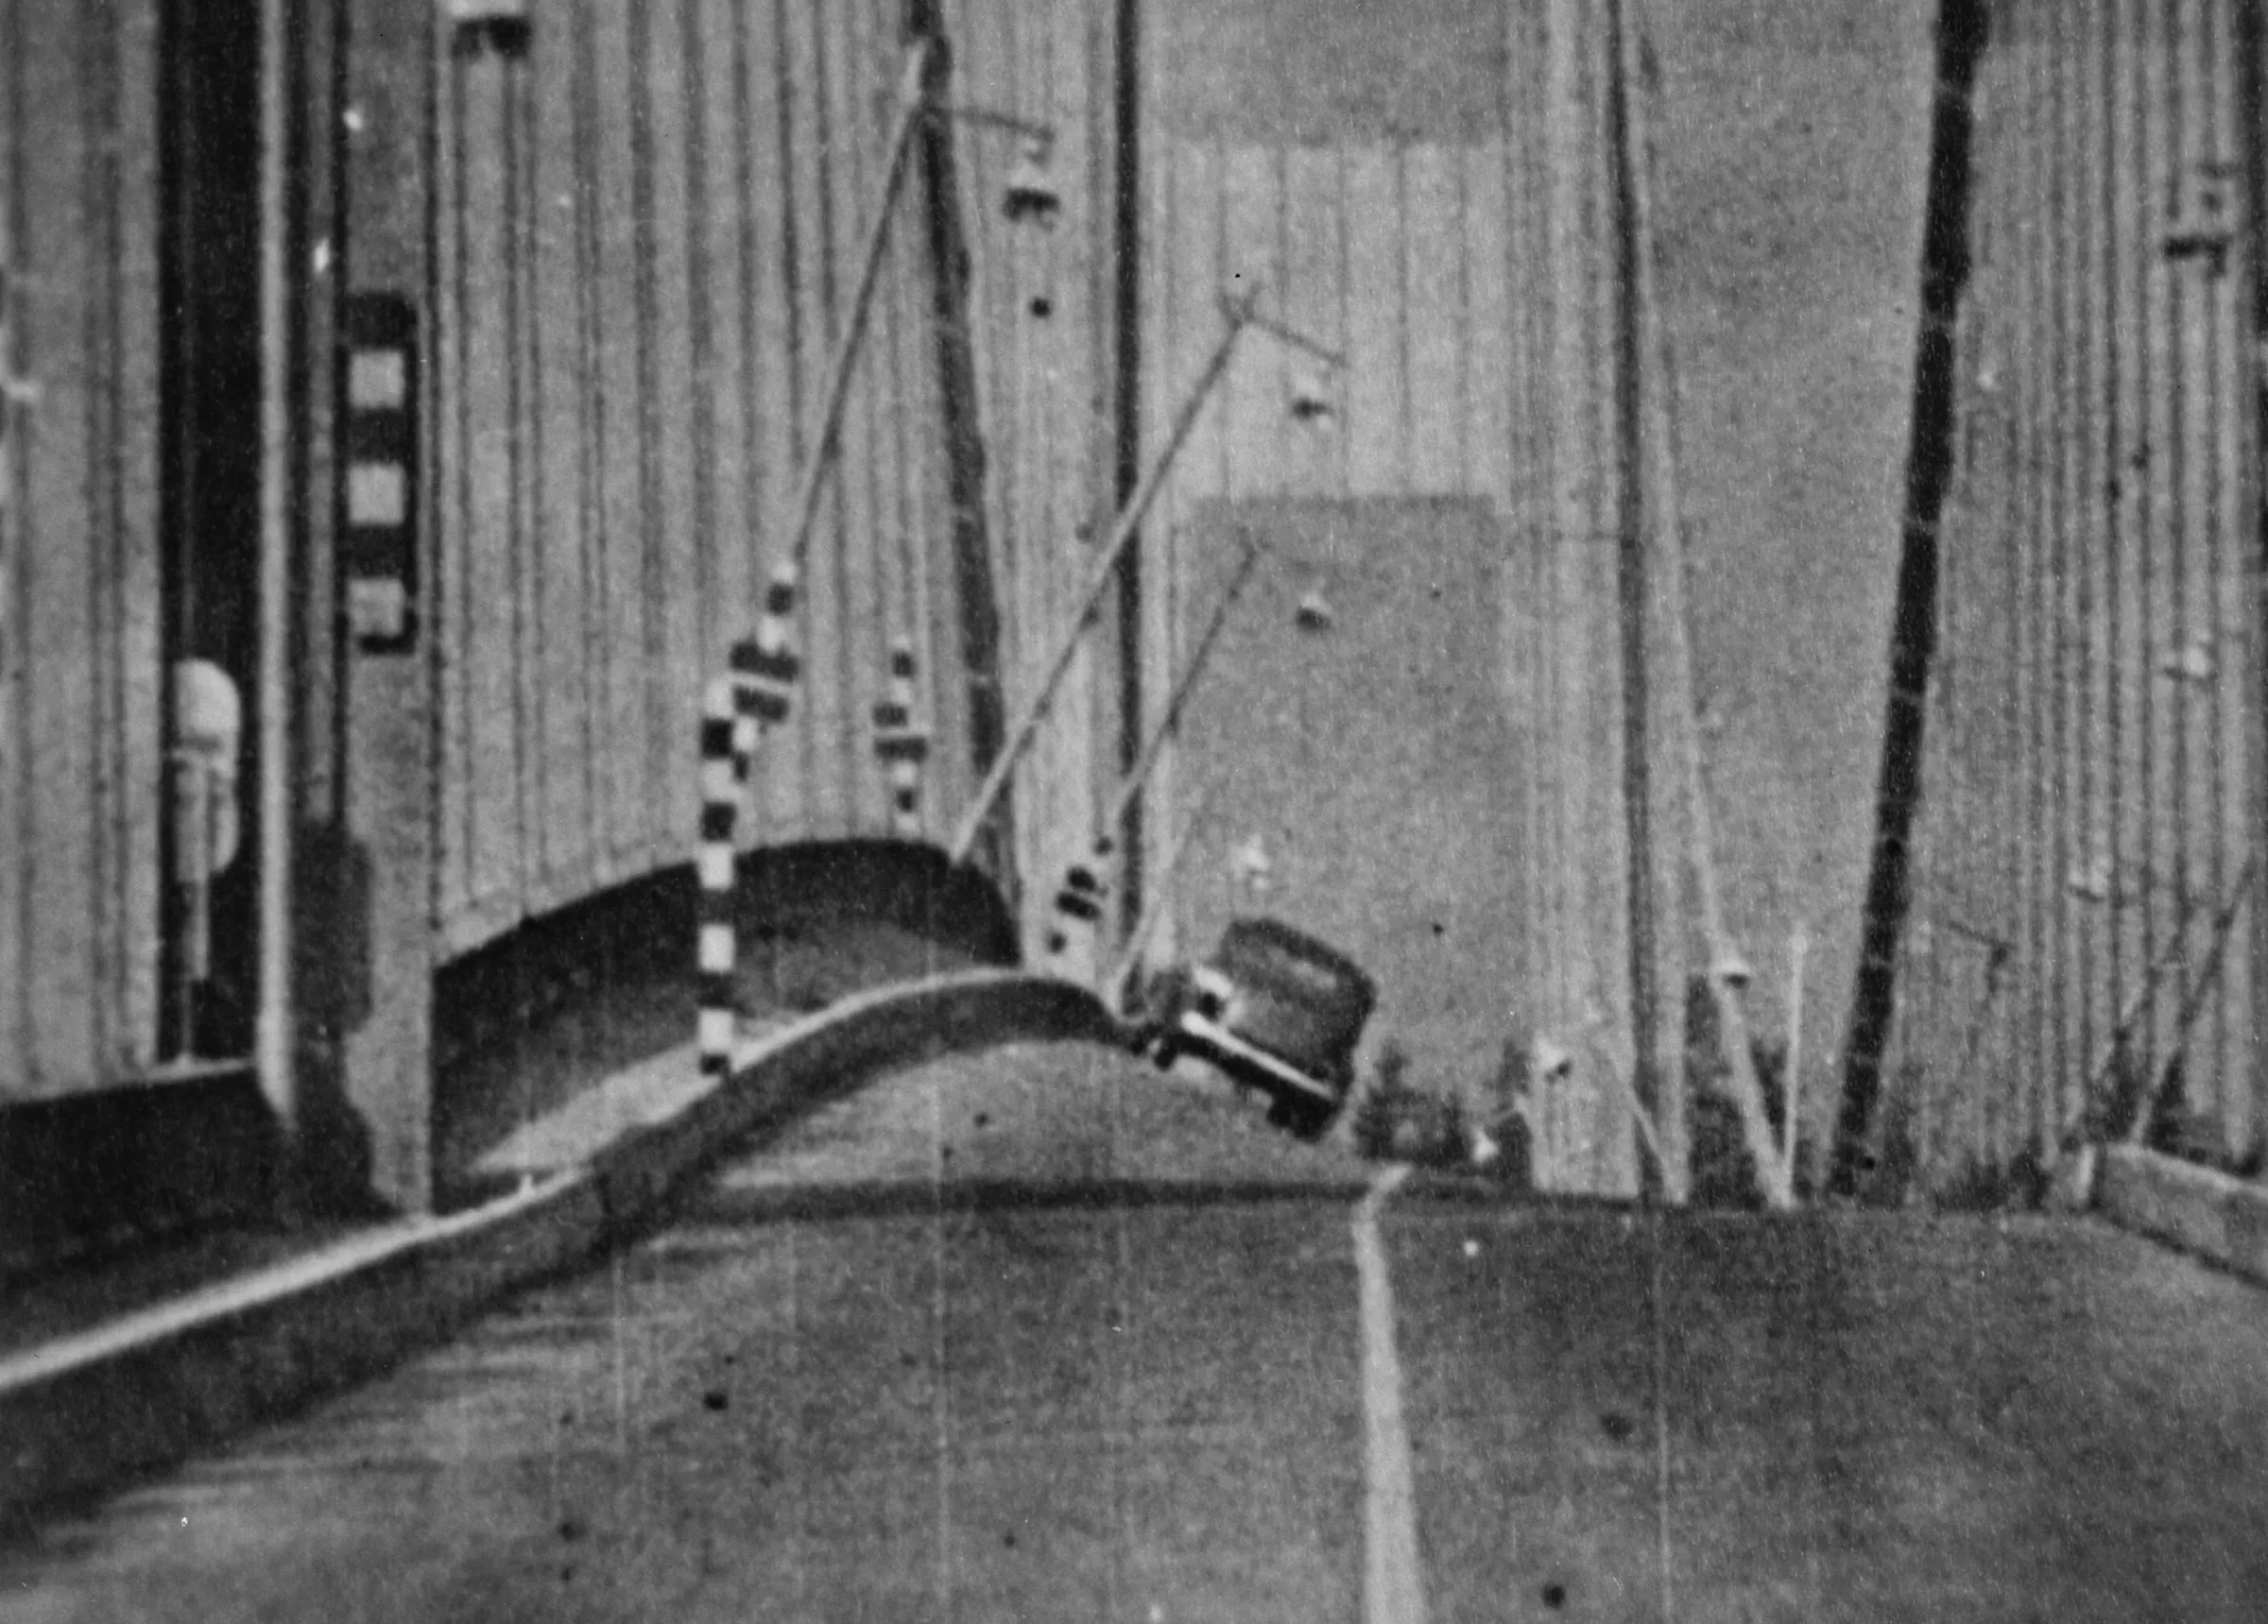
On the image The bridge had been nicknamed Galloping Gertie for months: its wobble was visible, measured and filmed long before the failure. The oscillation grew until the deck tore apart, the engineering version of Sornette’s claim that a system racing toward a breaking point can leave a readable signature on the way up. The Tacoma Narrows Bridge twisting on the morning of its collapse, Washington, 7 November 1940. Frame from film by F. B. Farquharson, University of Washington, reproduced in the Historic American Engineering Record (public domain), via Wikimedia Commons.
If you believe the last two essays, prediction is mostly a fool’s errand. Crashes come from inside, the biggest moves have no cause worth the name, and looking for the grain that set off the avalanche means looking for something that was never special. Take that seriously and the only sane move is defense: carry slack, cut leverage, expect the slide.
Didier Sornette spent a career arguing that this gives up too soon. Not for every crash, but for one particular kind, the blow-off top at the end of a bubble. His claim is that a bubble has a shape, that you can see the shape while it is still forming, and that the shape tells you something, with all the usual hedges, about when it will break. This is the optimistic case in the series, and it deserves a fair hearing, including the places it falls apart.
#I. Two kinds of growth
Start with the difference between fast and dangerous.
Exponential growth is what compound interest does. A fixed percentage each period, so the thing doubles on a regular schedule. It looks dramatic, but the growth rate is constant. A savings account, a healthy company, a population with steady birth rates: all exponential, all sustainable in the sense that nothing about the rate is speeding up.
A bubble is something else. In a bubble the growth rate itself grows. Prices rise, and the rise pulls in buyers who push prices up faster, which pulls in more buyers still. The price rises, and the speed of the rise rises with it. This is faster-than-exponential growth, and it has a strange property: it does not head toward infinity in the far future, it heads toward infinity at a specific finite time. Mathematicians call that a finite-time singularity. In a market it cannot literally happen, so what the singularity really marks is the moment the trend has to break.
Before you look: both curves below start out rising together. What single chart trick would tell healthy compounding apart from a bubble?
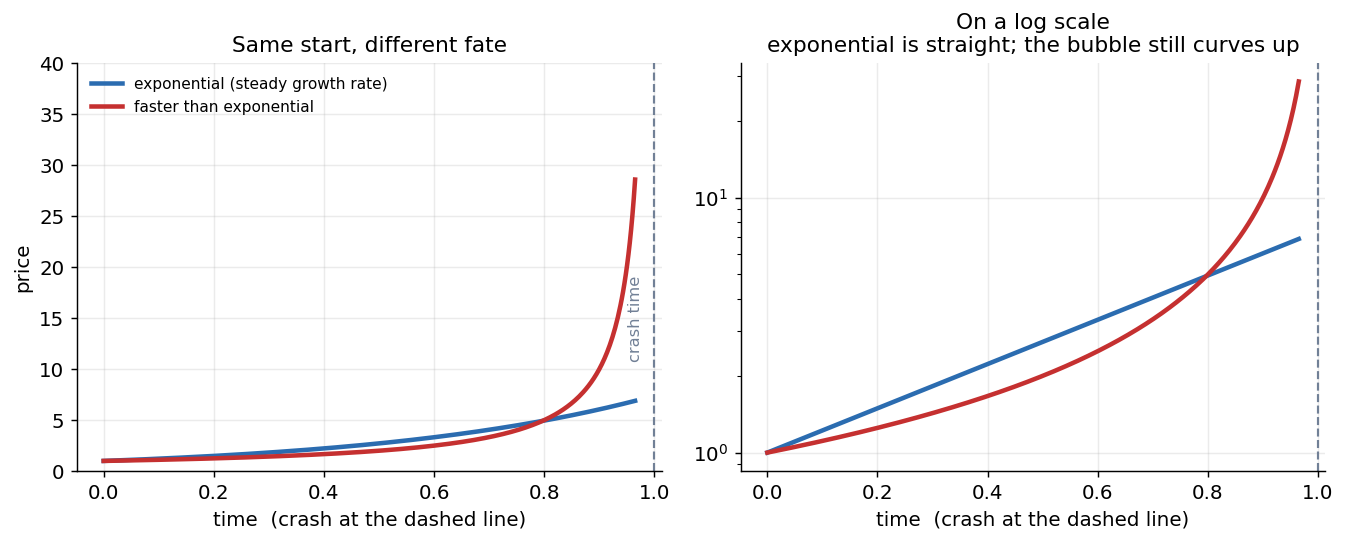
Exponential growth has a constant rate, so on a log scale it is a straight line. Faster-than-exponential growth keeps curving up even on a log scale, and it runs into a wall at a finite time. That wall is the danger.
You can see that shape in any real bubble. The Nasdaq Composite more than doubled in 1999 alone, kept accelerating into a peak of 5,048.62 on March 10, 2000, and then gave back 78 percent of its value over the next two and a half years.
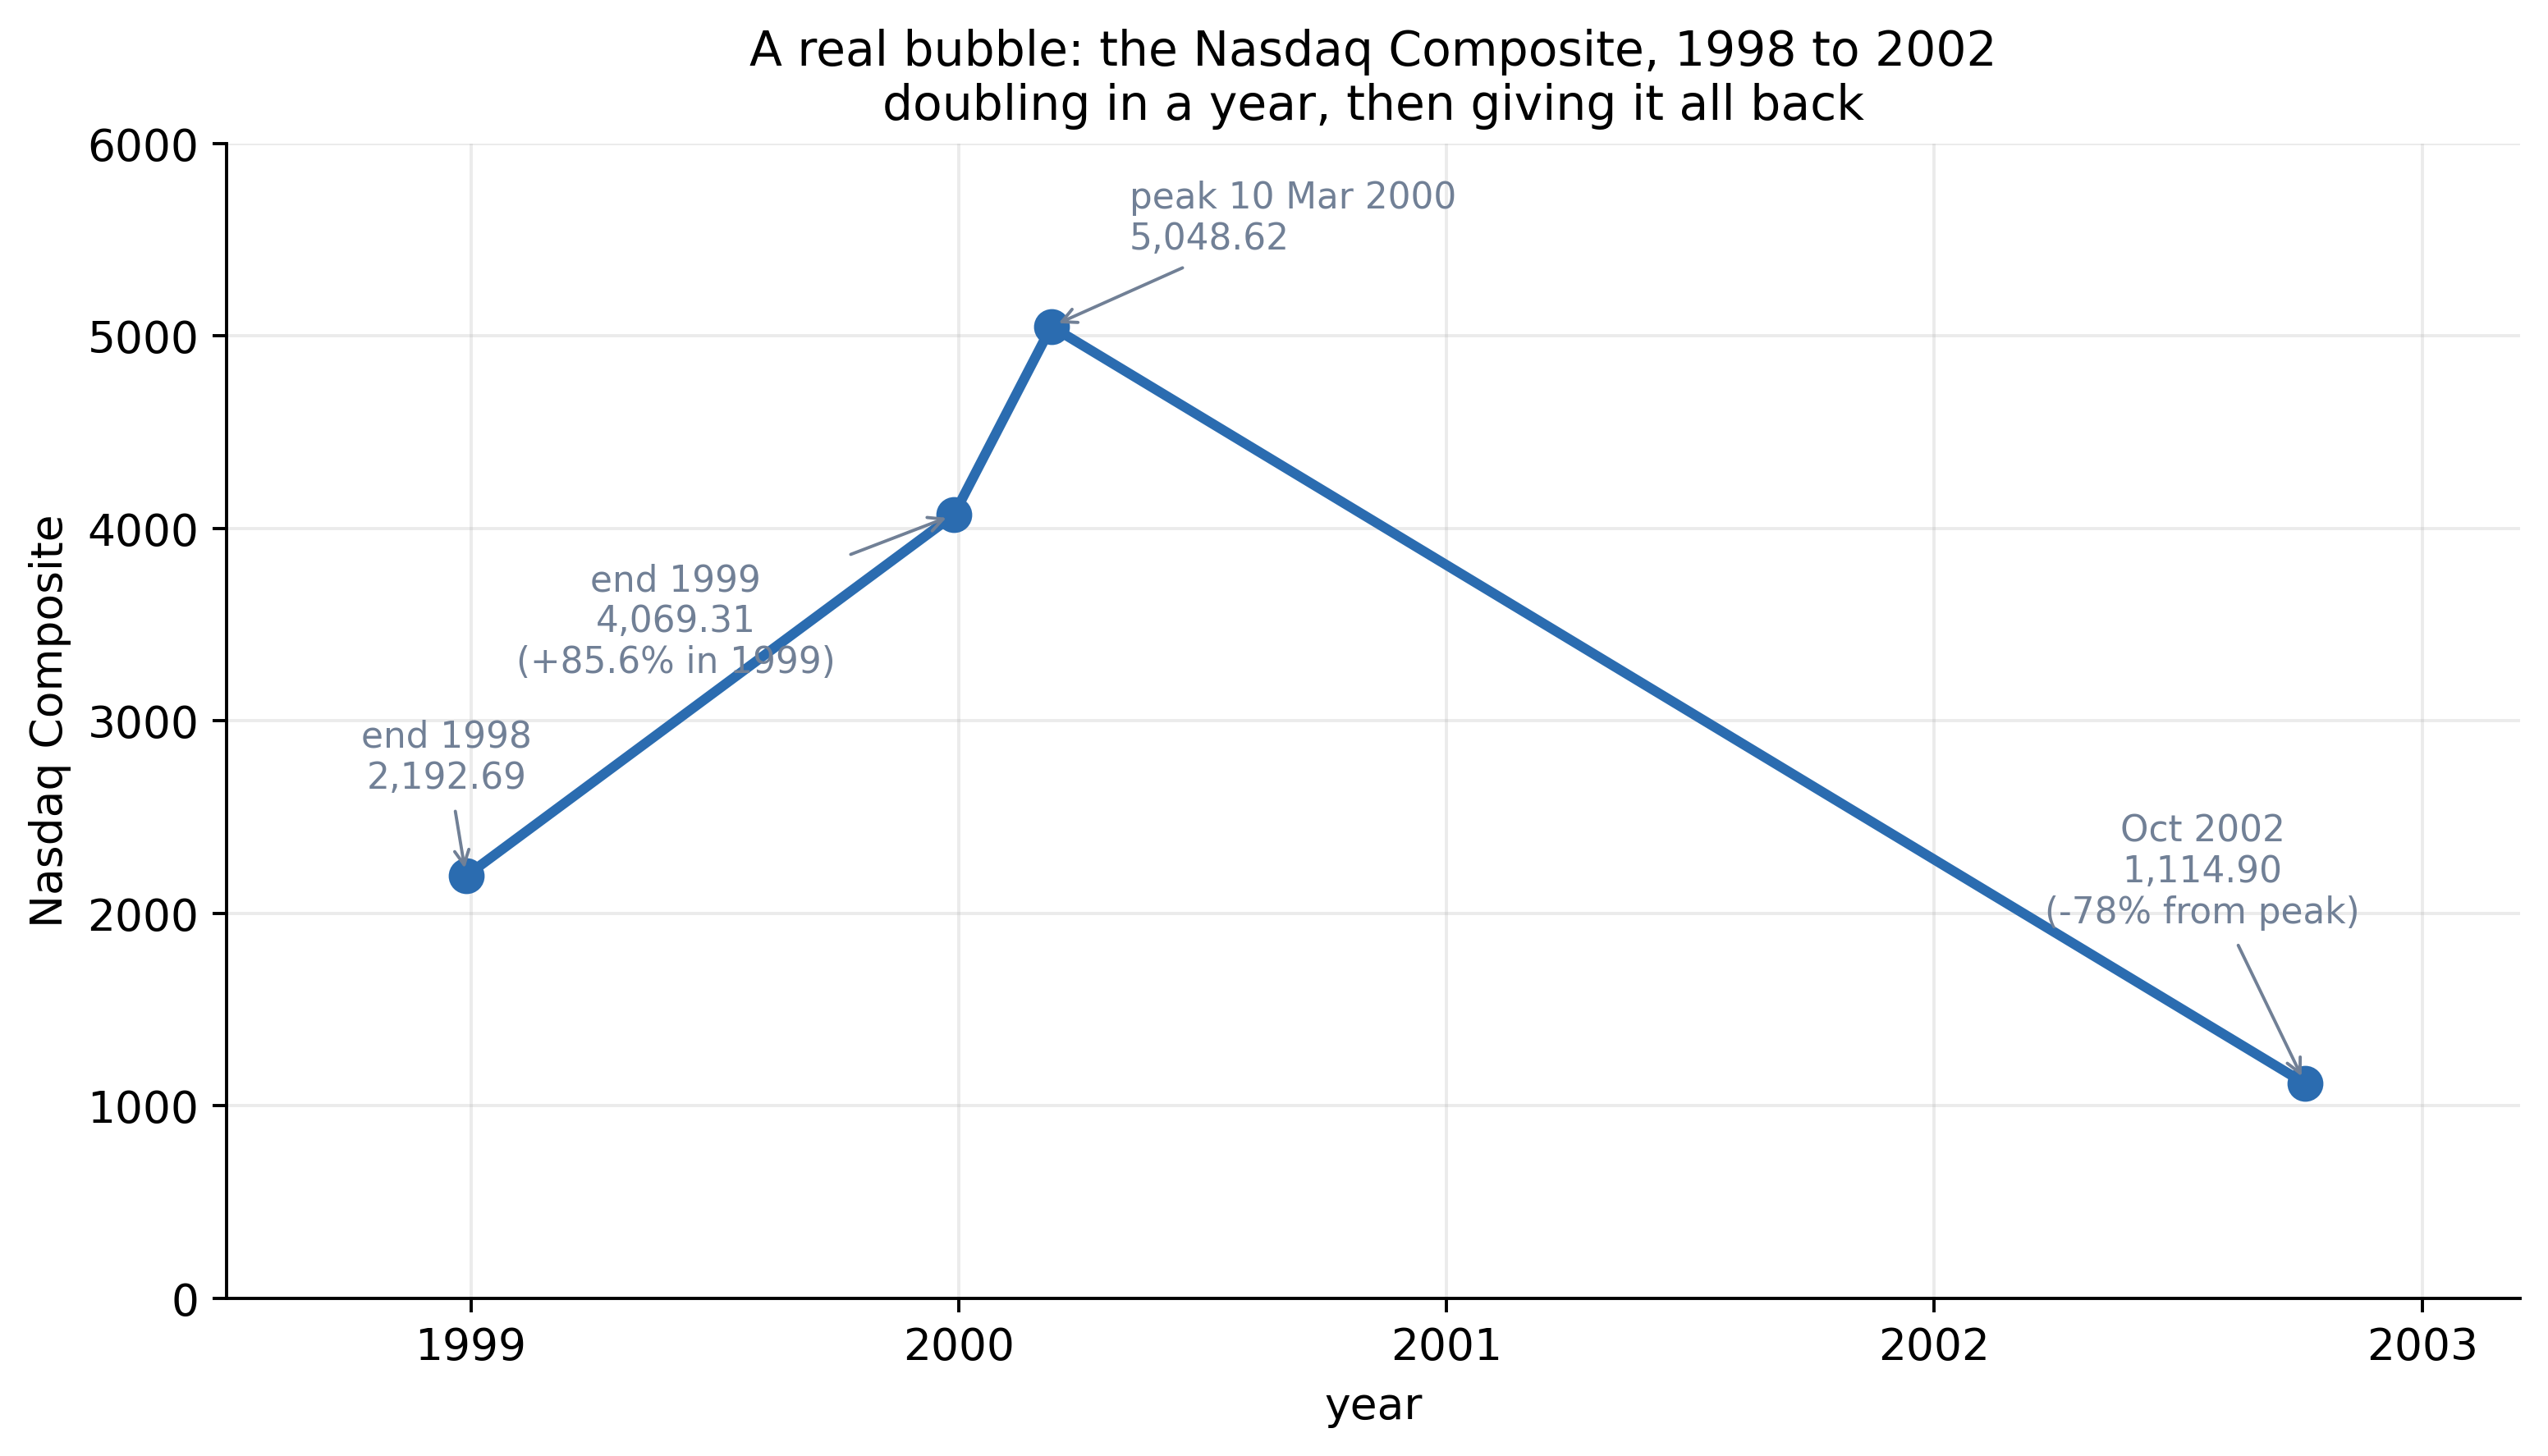
The dot-com bubble in the Nasdaq Composite, from a few verified closes. The climb steepens toward the peak, the mark of faster-than-exponential growth, and the fall gives back years of gains.
The log-scale panel on the right is the quick test. Steady compounding is a straight line there. A bubble keeps bending upward, because the rate keeps rising, and that upward bend is the fingerprint of the positive feedback that cannot last.
#II. The wobble that gives it away
Here is where Sornette goes past everyone else. He argues that the climb toward the singularity is not smooth. It carries oscillations, and the oscillations speed up as the critical time approaches, squeezing closer and closer together near the end.
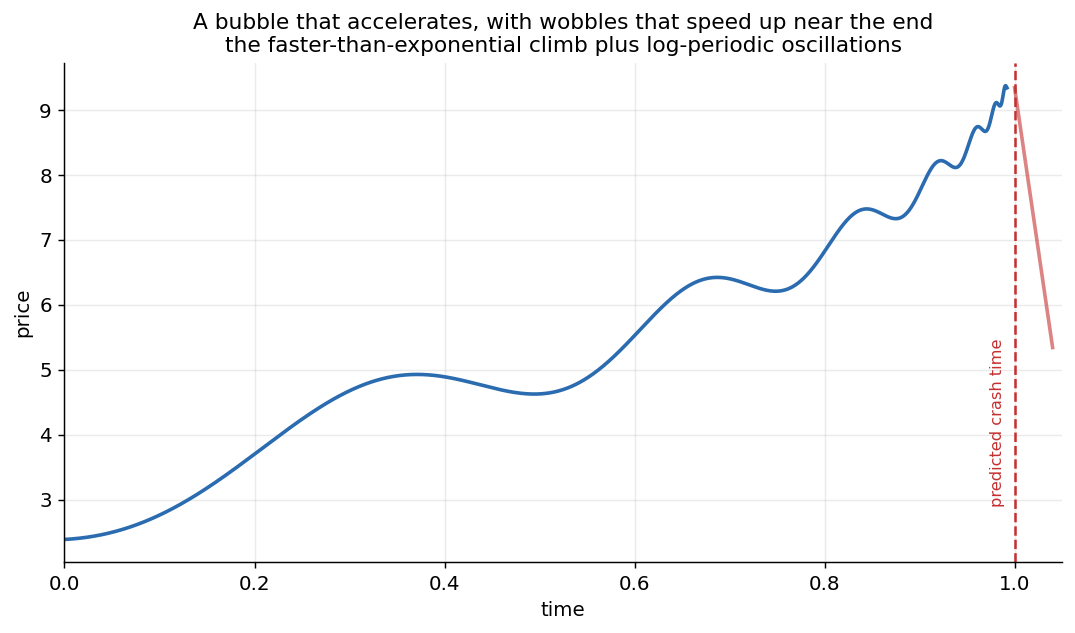
The bubble accelerates, and the wobbles on the way up get faster as the end nears. Sornette’s model fits this shape to estimate the crash time. The wobbles are the part that is supposed to let you read the clock.
The technical name is a log-periodic power law, and the intuition behind the wobble is that the herding has a kind of rhythm, a discrete echo that gets compressed in time as the system tightens toward its critical point. You do not need the machinery. The claim is simply that a forming bubble has both an accelerating trend and an accelerating wobble, and that fitting both at once pins down the critical time better than the trend alone. Sornette built an entire research program around this, the Financial Crisis Observatory at ETH Zurich, dedicated to fitting these shapes to live markets and logging the forecasts in advance.
Move the shape yourself. More feedback bends the path harder; more wobble makes the clock more visible; moving the critical time shifts the wall. The point is to see the geometry, not to pretend the date is cleanly measurable from real data.
Open this simulation in Explore →
#III. Dragon kings and black swans
This is a direct quarrel with Taleb, and Sornette picked it on purpose.
Taleb’s black swan is an event so far out in the tail that it is effectively unpredictable. In the language of the earlier essays, it sits on the power-law line: rare, large, but the same kind of thing as a small event, just a more extreme draw from the same distribution. Nothing about it is special except its size, so nothing lets you see it coming.
Sornette’s answer is the dragon king. His claim is that the very largest events in some systems are not on the line. They are a separate population, generated by a different mechanism, the runaway feedback of a bubble reaching its critical point. And because they have their own mechanism, they leave their own signature, which means they are partly foreseeable in a way a black swan is not.
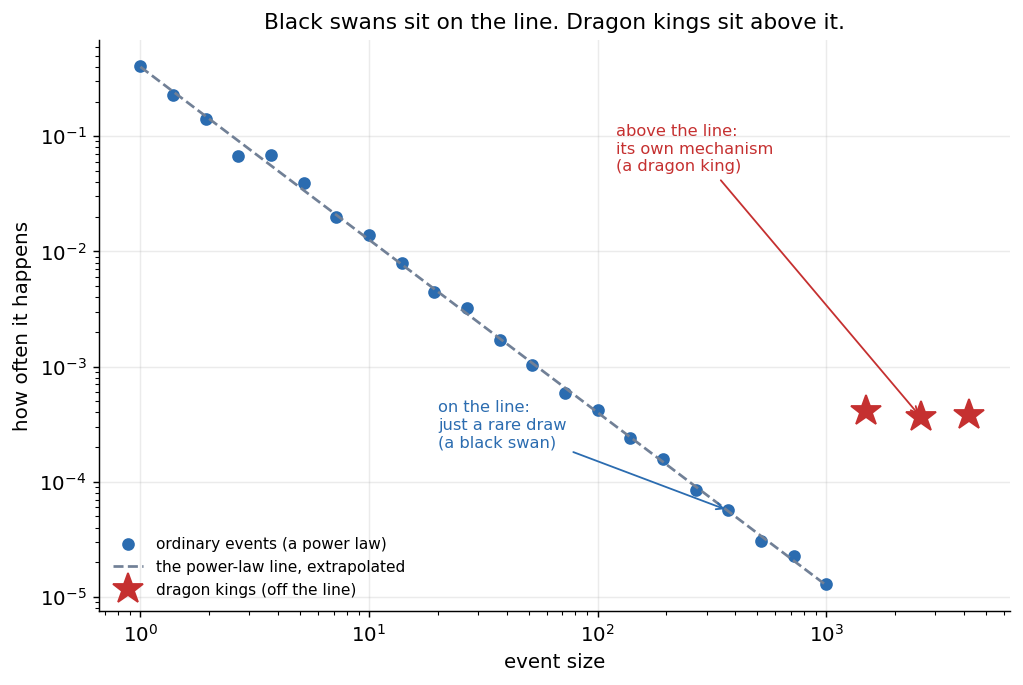
A black swan sits on the line: a rare draw from the same law. A dragon king sits above the line: too big and too frequent to belong to that law, the mark of a separate mechanism. Sornette’s bet is that dragon kings, unlike black swans, give warning.
So the disagreement is sharp and clean. Taleb says the giant events are unforeseeable and you should build robustness. Sornette says a subset of giant events announce themselves and you can act on the warning. They cannot both be fully right, and the fight is more useful than either position alone.
#IV. How much to believe
I find the picture compelling and I would not trade on it, and those two things are not in tension.
The honest reading is that Sornette is on strong ground about the mechanism and much weaker ground about the forecast. That a bubble is faster-than-exponential feedback heading for a break is convincing and well evidenced. That you can read the date of the break off the wobbles is far shakier. The critical time the model returns is not a date but a wide, fuzzy probability, and Sornette himself frames the crash as a random event whose odds rise as you approach. The fits look gorgeous after the fact. The live, pre-registered record is thinner and contested, and it suffers the usual selection problem, where the hits get remembered and the misses get explained. A bubble can also deflate without a crash, sliding back down instead of snapping, so the singularity is a hazard that can be avoided, not a destiny.
Sornette’s group did put this on the record rather than only claiming hits afterward. In 2009 they ran what they called the Financial Bubble Experiment, posting sealed forecasts in advance and revealing them only later so the calls could not be quietly edited. One flagged the Shanghai Composite as a faster-than-exponential bubble and named a crash window of July 17 to 27, 2009. The index stalled through late July and fell about 20 percent over the first half of August, missing the stated window, though the index did fall sharply a few weeks later. They have pointed to similar advance reads on the 2008 oil spike and the mid-2000s US housing peak. The hits are real, the misses are too, and telling them apart ahead of time is exactly what the pre-registration was built to force.
None of that kills the idea. It just sets the right expectation. The signature is real. Whether the signature is tradeable is a different and much harder claim, and Sornette is on much firmer footing for the first than the second.
#V. What it is good for
Used correctly, this works as a regime detector rather than a market-timing tool, and that is still worth a great deal.
If a market is climbing faster than exponentially, with the trend bending up even on a log scale, you are in a positive-feedback regime that, by its own internal logic, has to end, and probably end sharply. You cannot say when. You can say that the distribution of what happens next has gone one-sided, that the crash hazard is elevated, and that this is the time to act like the previous essays told you to: trim, hedge, hold the insurance you bought when it was cheap.
The right way to use Sornette is to let his diagnosis tell you when to behave like Taleb. The next essay puts a number on how reflexive markets actually are. After that, the series asks how flows move prices, what the calm itself can tell you, and why the one quantity you would need to trust here, how close the market is to its critical point, is exactly the quantity you cannot.
#Further reading
The bubble-as-critical-point model:
- Johansen, A., Ledoit, O., and Sornette, D. (2000). Crashes as Critical Points. International Journal of Theoretical and Applied Finance, 3(2).
- Sornette, D. (2003). Why Stock Markets Crash: Critical Events in Complex Financial Systems. Princeton University Press.
- Kindleberger, C. P., and Aliber, R. Z. (2015). Manias, Panics, and Crashes: A History of Financial Crises. Palgrave Macmillan. The financial-history companion to the bubble-as-critical-point picture.
- Nasdaq OMX Group. NASDAQ Composite Index (NASDAQCOM). Retrieved via FRED, Federal Reserve Bank of St. Louis.
Dragon kings versus black swans:
- Sornette, D., and Ouillon, G. (2012). Dragon-Kings: Mechanisms, Statistical Methods and Empirical Evidence. The European Physical Journal Special Topics, 205.
The pre-registered Shanghai forecast:
- Jiang, Z.-Q., Zhou, W.-X., Sornette, D., Woodard, R., Bastiaensen, K., and Cauwels, P. (2009). The Chinese Equity Bubble: Ready to Burst. arXiv:0907.1827.
- Sornette, D., Woodard, R., Fedorovsky, M., Reimann, S., Woodard, H., and Zhou, W.-X. (2009). The Financial Bubble Experiment: Advanced Diagnostics and Forecasts of Bubble Terminations. arXiv:0911.0454.
On video:
- Didier Sornette, How we can predict the next financial crisis (TED). The dragon-king and log-periodic argument in fifteen minutes.
From the series The Edge of Chaos.
Written with an LLM in the loop, like everything here. The ideas and the mistakes are mine. More on how I write.