Sandpiles and Crashes: How Systems Tune Themselves to the Brink
The last essay left a loose end. Markets can sit near a critical edge where small shocks cascade, but critical points are usually finely tuned, so who keeps a market balanced there? The answer, found in a pile of sand, is that nobody does. Some systems walk to the brink on their own, and that is where their crashes come from.
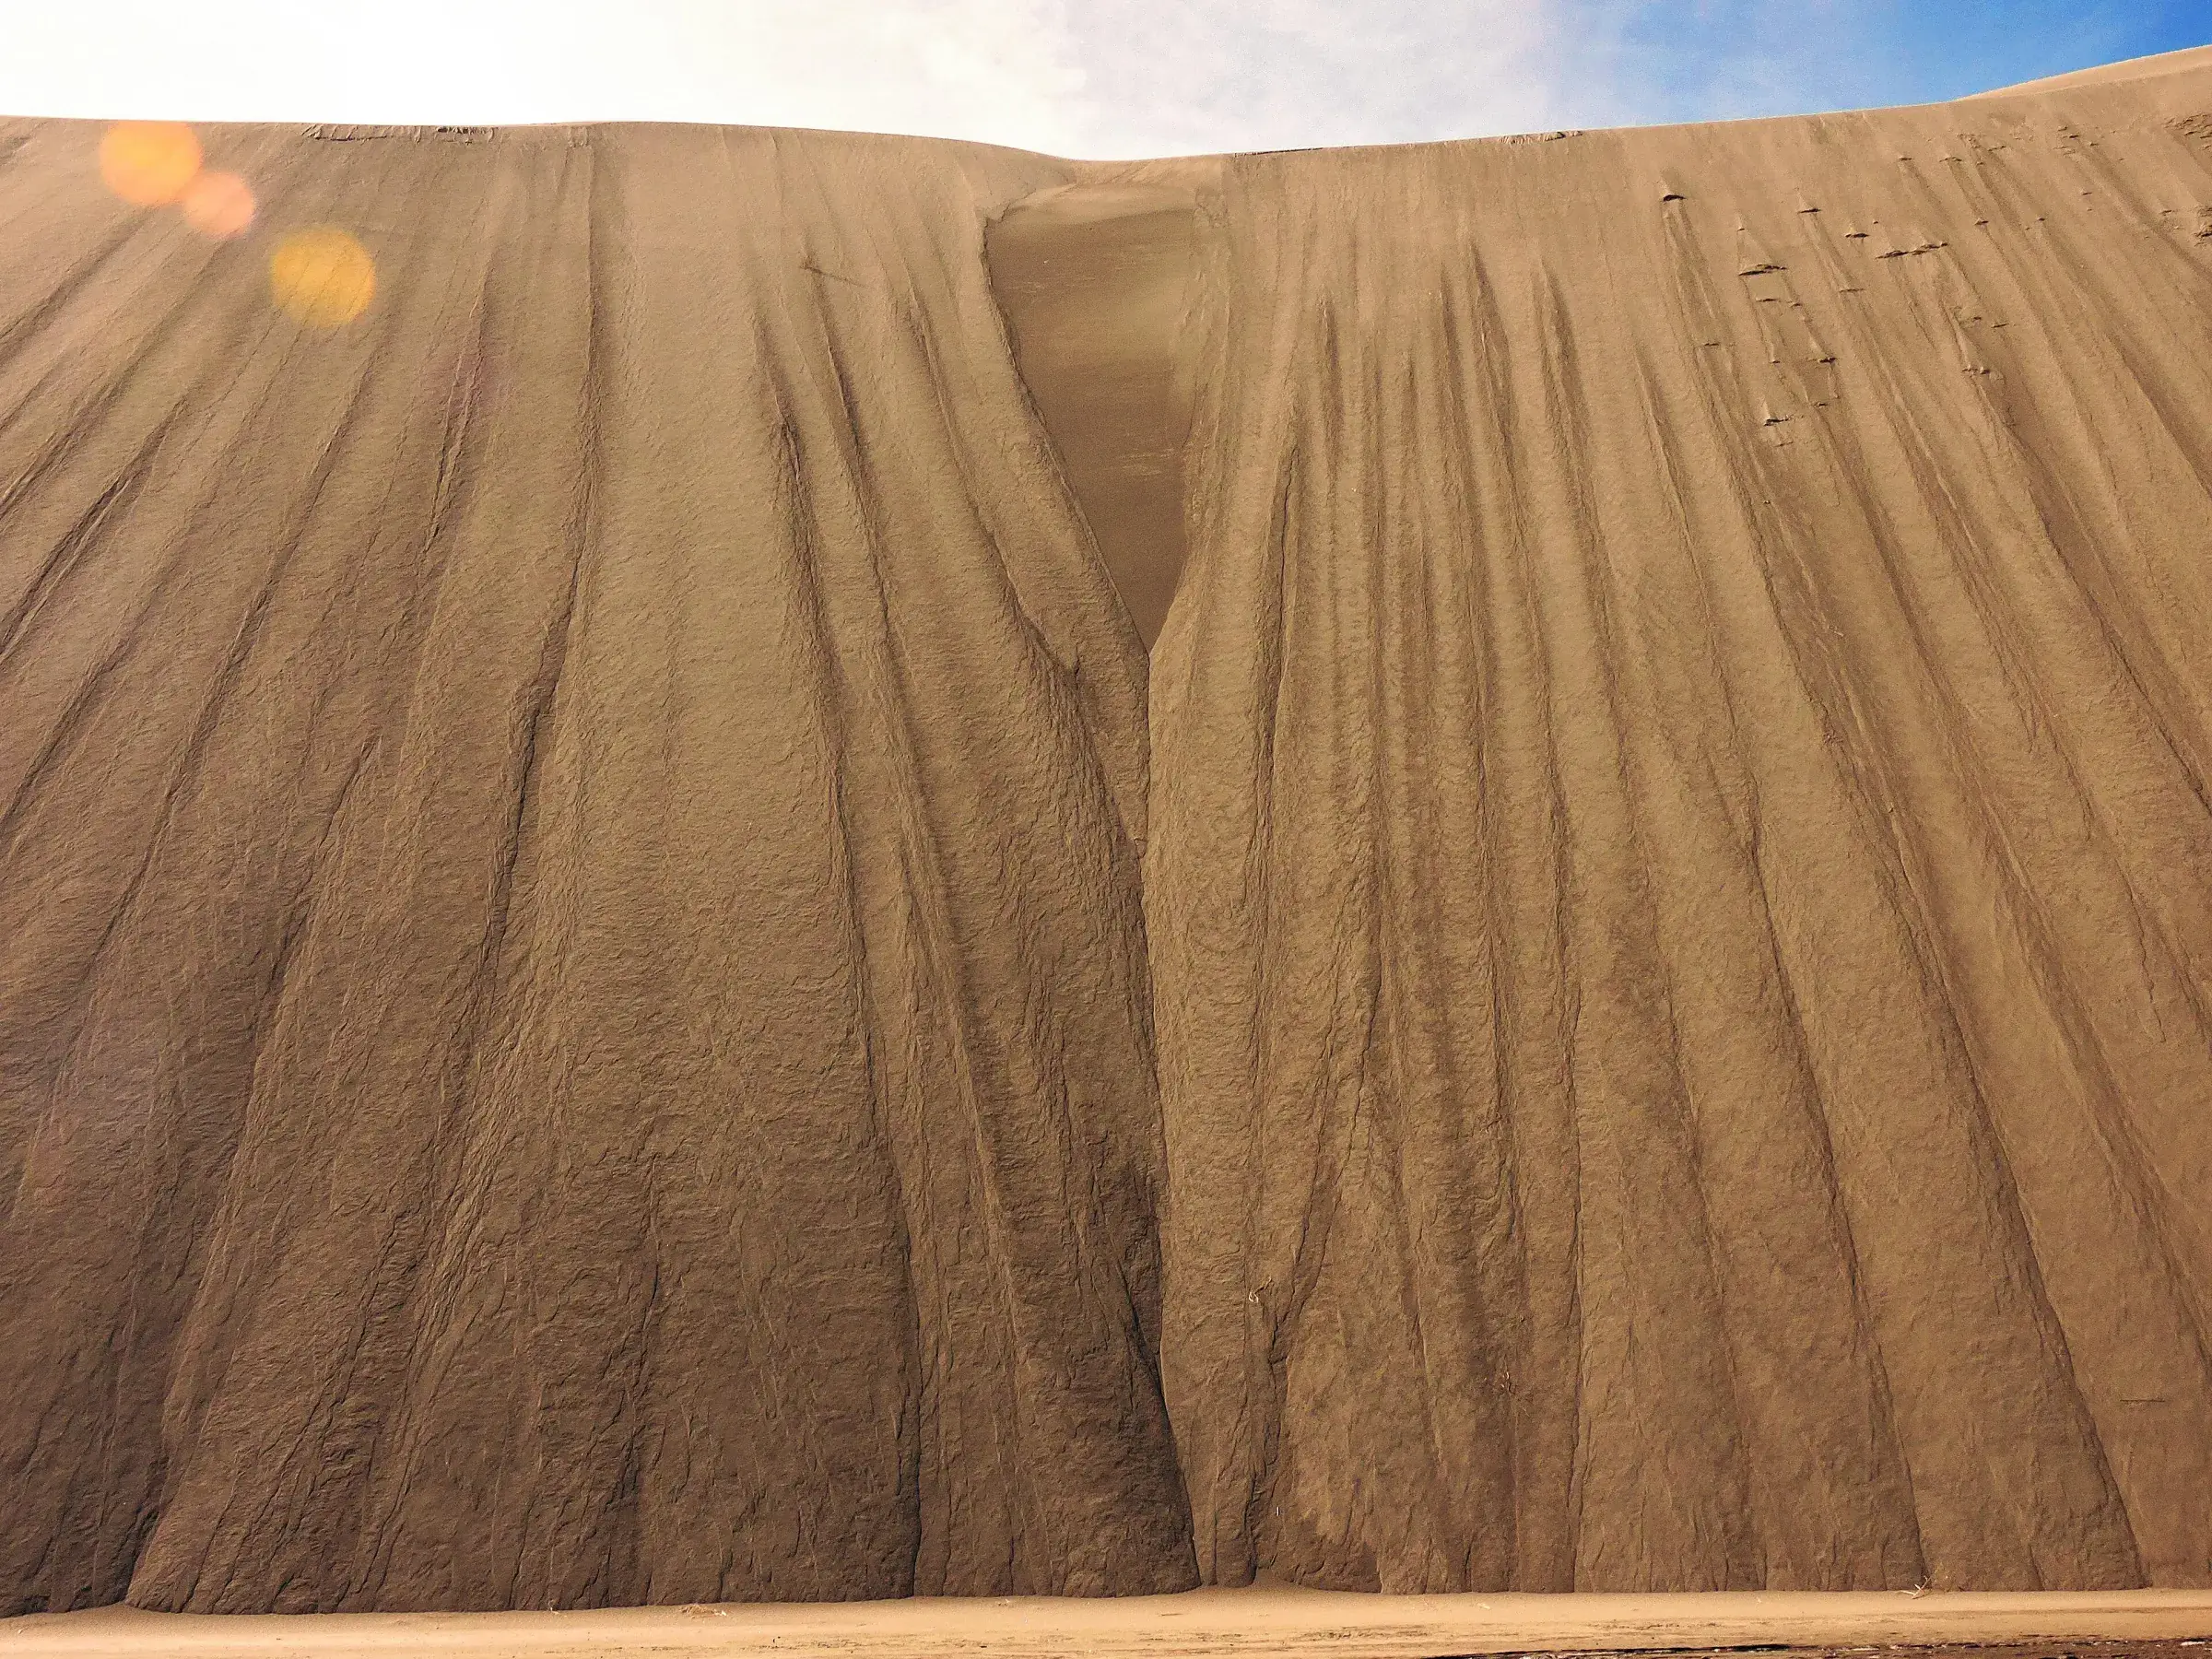
On the image Wind keeps adding grains until the slip face sits at its angle of repose, and then it sheds sand in slides of every size, from a trickle to the deep central chute. Nobody tunes the slope to that edge; the pile walks there by itself, which is Bak’s sandpile in the wild. Avalanche chutes on the slip face of a dune, Great Sand Dunes National Park, Colorado, 2018. Photo: Patrick Myers, National Park Service (public domain), via Wikimedia Commons.
The last essay ended with a puzzle it did not solve. Markets, it argued, sit near a critical point, the knife-edge where a tiny shock can cascade into a huge move. But phase transitions are fussy. Water turns to ice at one exact temperature. A magnet loses its magnetism at one exact spot on the dial. To sit near that kind of edge, something usually has to hold the dial there with great care.
So who holds the market’s dial? Who tunes millions of independent traders to balance near the edge?
The answer, worked out in 1987 by three physicists, is that nobody does. Some systems walk to the edge on their own and stay there. Per Bak, Chao Tang, and Kurt Wiesenfeld called it self-organized criticality, and the toy they used to show it was a pile of sand.
#I. A pile of sand
Drop sand onto a table, one grain at a time. At first the grains sit where they land. The pile grows, the sides get steeper, and now and then a grain you add rolls a little and knocks another loose. Keep going and the slope reaches a steepness it cannot exceed. Add one more grain there and you might get nothing, or a small slip, or a slide that takes a whole face of the pile down at once. From then on the pile holds that slope. Add sand and it sheds sand, in fits and starts, forever.
That is the whole idea, and it boils down to a rule simple enough to run on a grid. Give every cell a count of grains. Drop a grain on a random cell. If a cell ever holds four or more, it topples: it gives one grain to each of its four neighbors and keeps the rest. Grains that fall off the edge of the grid are gone. A neighbor that just received a grain might now hold four itself, so it topples too, and the spill can run on and on. Count how many topplings a single added grain sets off. That count is the avalanche.
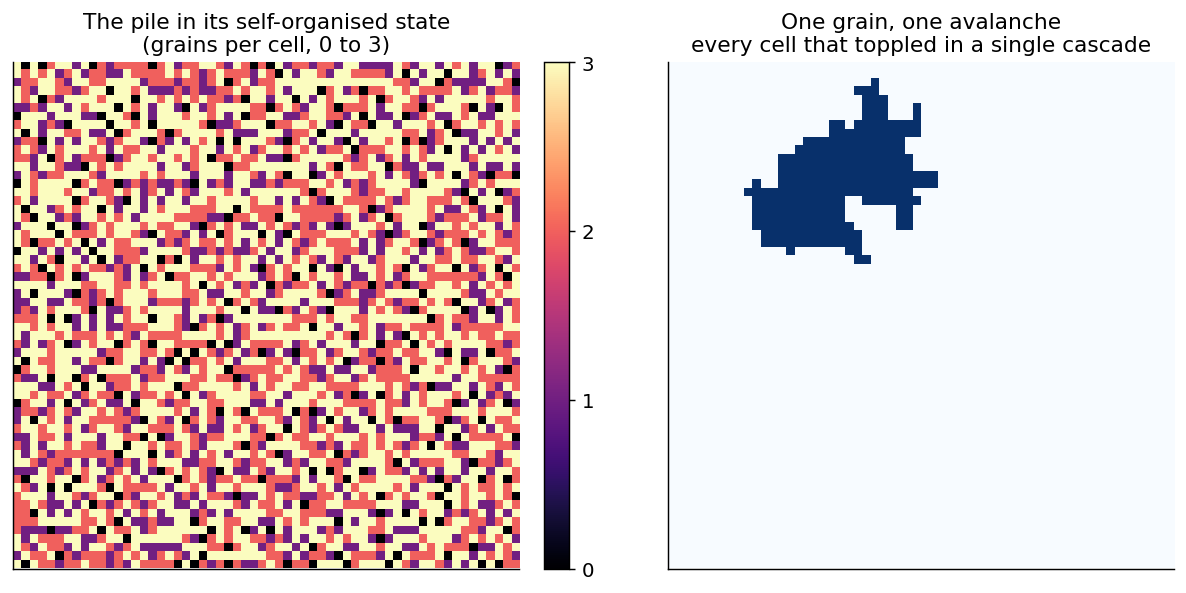
Left, the pile after it has settled into its self-organized state, with cells spread below the toppling threshold. Right, the footprint of one avalanche: every cell that toppled after a single grain landed.
Start the grid empty and drip grains. Early on, little happens. The pile fills up, cells get fuller, the first avalanches appear. Before long it settles into the state on the left, loaded across the grid and close to the edge of toppling. It got there by itself. No one set the slope. The pile found it and stays there.
Run it yourself. The red cells are the last avalanche. Most drops barely move anything, but every so often one grain runs through a large part of the pile. The histogram on the right builds the fingerprint as the pile runs.
Open this simulation in Explore →
#II. Avalanches of every size
Now the surprising part. Record the size of every avalanche, meaning how many topplings each added grain triggers, and count how often each size shows up. Guess first: is there a typical avalanche, the way human heights cluster around an average? You do not get that. You get this.
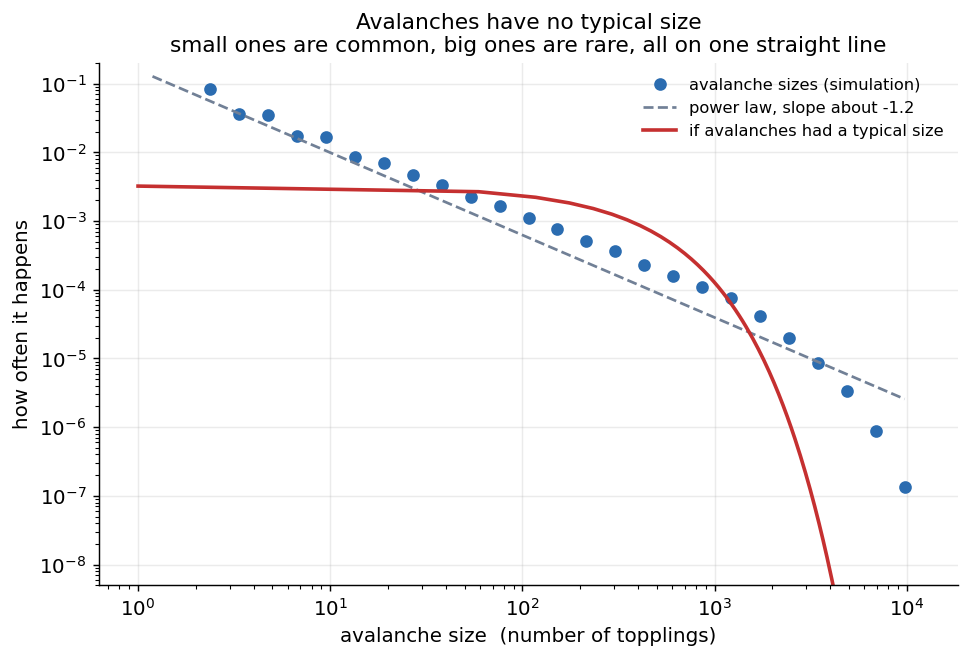
On a log-log plot the avalanche sizes fall on a straight line. That is a power law, and it means there is no typical avalanche. The red curve shows what a world with a typical size would look like, where anything much bigger than average essentially never happens. The pile lives elsewhere.
A straight line on a log-log plot is a power law, and a power law has no characteristic scale. Tiny avalanches are common, big ones rare, enormous ones rarer still, but they all sit on the same smooth slope. There is no special size where the pile says “this one is normal and that one is a freak.” The red curve is the bell-curve intuition, a world with a typical size where large events are effectively impossible. The pile lives somewhere else. Big avalanches are rare, but they are always on the menu.
Here is the part that should sound familiar from the last essay. Every grain is identical. The grain that sets off a thousand-cell cascade is exactly the same as the millions of grains that did nothing. The big avalanche has no special cause. It is the same process as a small one that happened to keep going. A crash without a cause, built into the rules.
#III. The calm is the setup
Watch the avalanches over time and the pattern is its own kind of warning.
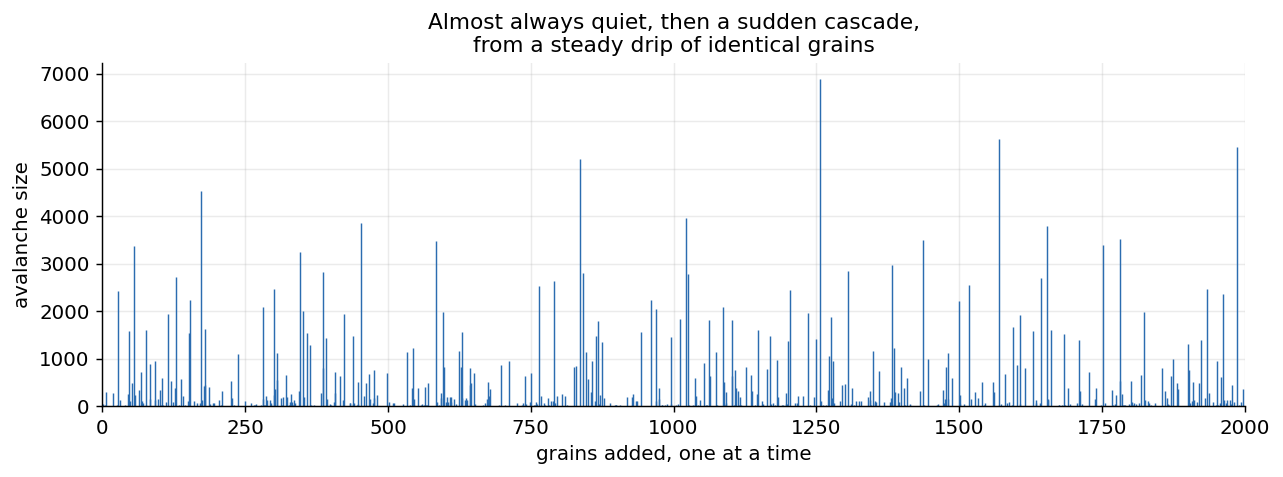
Long quiet stretches broken by sudden cascades, all from the same steady drip of identical grains. The quiet and the cascade are the same state at different moments: loading and release.
Nothing changes about the input. The grains keep coming at the same rate, all alike. Yet the output is long calm punctuated by sudden collapse. The calm and the cascade belong to the same regime, one quietly loading and the other releasing. Every quiet grain nudges the pile a little closer to the next slide. The stillness is the system loading itself.
#IV. What “self-organized” means
This is the piece the last essay was missing. The magnet model needed someone to set the temperature close to its critical value by hand. The sandpile needs no one. Three plain ingredients do the tuning automatically: a slow drive, the grains added gently one at a time; a threshold, the rule that a cell holds on until it reaches four and only then lets go; and leakage, the grains that fall off the edges and leave.
Put those together and the pile drives itself to the critical slope and stays there. Push it too hard and avalanches carry off the excess; let it slacken and the drip builds it back up. The system falls toward the critical state from wherever it starts.
It is worth connecting this to the attractor picture from the last essay. There the critical point was a knife-edge someone had to tune the dial to by hand, the unstable border between two stable moods. Self-organized criticality turns that border into a destination. The slow drive, the threshold, and the leakage make the critical state itself an attractor of the pile’s dynamics, and every avalanche is the restoring nudge that carries the pile back to the edge after it slips over. Nothing has to balance the market on the edge by luck or by a careful hand. The loading and the cascades pull it there and keep it there.
One word is worth being exact about. An idealized, infinitely large pile would sit exactly at the critical slope. A real one, finite and constantly disturbed, hovers just below it, tipping over and settling back. That gap is not vagueness in the theory, it is the difference between the clean critical point of an equation and the restless, driven version a market actually lives in. Either way the moral holds, and it answers the question we opened with: nobody tunes the market to the edge, because a market that keeps loading risk and shedding it in cascades tunes itself there.
#V. The same fingerprint everywhere
Bak’s claim was bigger than sand. The same signature, events of every size with no typical scale and no special cause, turns up across nature. Earthquakes obey it: the Gutenberg-Richter law says that a quake ten times larger is a fixed factor rarer, a straight line on a log-log plot, and a great earthquake is just a small tremor whose rupture kept going. Forest fires follow it, and solar flares, and real snow avalanches, and bursts of firing in networks of neurons, and even the sizes of extinctions in the fossil record. Different machinery, the same statistical shape. This is the universality from the last essay again. Near the critical state the details stop mattering and only the large-scale pattern survives, which is exactly why a model of sand can have anything to say about a market.
#VI. Markets as sandpiles
The mapping to finance is concrete, even if it stays an analogy and not an identity. The grains are risk piling up: leverage taken on, positions crowding into the same trades, stop-loss orders stacked at similar prices, promises to deliver that quietly depend on everyone else delivering. The slow drive is an ordinary calm market, where risk accumulates precisely because nothing has gone wrong lately. The toppling is forced selling: a margin call, a triggered stop, a fund that has to liquidate, which pushes the price down, which trips the next stop, which pushes the price again. One sale sets off the next, exactly like one toppling cell spilling into its neighbors.
October 19, 1987 is the textbook case. By then a product called portfolio insurance covered something like 80 billion dollars of holdings, all following the same mechanical rule: when prices fall, sell index futures to hedge. Because everyone ran the same rule, the early decline that Monday told all of them to sell at once, the selling drove prices lower, the lower prices told the programs to sell still more, and the loop fed itself. The Brady Commission that investigated the crash found the ten largest sellers accounted for half of all non-market-maker volume in the futures that day. The Dow fell 22.6 percent in a single session, the worst day in its history, with no news anywhere near large enough to explain it. A pile loaded with identical automatic selling rules, and one ordinary down day to start the slide.
And the output is the power law. Market moves have tails too fat for a bell curve. The big moves are far too common, and they fall on roughly a straight line on a log-log plot, a power law like the sandpile and the earthquakes, though with a steeper exponent of its own. Gabaix and colleagues, sifting tens of millions of trades, found the tail of large price moves following close to an inverse-cube power law, steady across markets and decades. The fat tails from the last essay are the avalanche distribution of a market that has loaded itself near the edge. This is the mechanism under the measurement we ended on last time. Bouchaud’s finding that markets sit close to criticality is what a self-organizing system would lead you to expect.
#VII. Efficiency is the road to the edge
There is a sting in this for anyone who runs anything. What pushes a market, or a supply chain, or a power grid toward the critical edge? Bouchaud’s answer, in his 2024 survey of the field, is uncomfortable. It is the pursuit of efficiency.
An efficient system has no slack. Every resource is used, every buffer trimmed, every part coupled tightly to the next so nothing is wasted. That is also a fair description of a sandpile at the critical slope: fully loaded, nothing to spare, every cell ready to pass a disturbance along. Slack is exactly what keeps a system below the edge. Redundancy, inventory, idle capital, traders who disagree with each other, all of it looks like waste in the good times, and all of it is what stops a local problem from becoming a system-wide cascade.
So the choice is a real tradeoff rather than a failure to optimize. You can have a maximally efficient system or a resilient one, but the same lever moves both, in opposite directions. Just-in-time supply chains learned this when one stuck ship or one shut factory rippled around the world. Tightly coupled, heavily leveraged financial systems relearn it every decade or so. Bouchaud’s line, that the quest for efficiency and the need for resilience may be incompatible, is the sandpile talking.
#VIII. What you can and cannot do with this
The sandpile is honest about its limits, and they are worth saying plainly.
The trigger does not tell you whether the big one is coming. Every grain is the same, so “what caused the crash” is close to meaningless. The honest answer is the slope, not the grain, and hunting through the news for the cause of an endogenous cascade is hunting for a grain that was never special.
But you can know what kind of system you are standing on. If market moves follow a power law, then large cascades are not flukes to be engineered away. They are a permanent feature of the system. You cannot say when one will arrive, but you can stop being surprised, and you can act on the slope instead of the grain: carry slack, cut leverage and tight coupling where you can, and read a long calm as loading rather than as safety.
That leaves one question hanging. If the big cascades are built in, and the trigger tells you nothing, is there anything in the run-up that does? Can you see the slope turn dangerous before it goes? That is exactly where Sornette says yes and Taleb says no, and it is where this series goes next.
#Further reading
The original idea:
- Bak, P., Tang, C., and Wiesenfeld, K. (1987). Self-Organized Criticality: An Explanation of 1/f Noise. Physical Review Letters, 59(4).
- Bak, P. (1996). How Nature Works: The Science of Self-Organized Criticality. Copernicus.
Power laws in nature and markets:
- Gutenberg, B., and Richter, C. F. (1944). Frequency of Earthquakes in California. Bulletin of the Seismological Society of America, 34(4).
- Gabaix, X., Gopikrishnan, P., Plerou, V., and Stanley, H. E. (2003). A Theory of Power-Law Distributions in Financial Market Fluctuations. Nature, 423.
- Gabaix, X. (2009). Power Laws in Economics and Finance. Annual Review of Economics, 1.
Self-organized criticality in finance, and the efficiency tradeoff:
- Bouchaud, J.-P. (2024). The Self-Organized Criticality Paradigm in Economics and Finance. arXiv:2407.10284.
The 1987 cascade:
- Presidential Task Force on Market Mechanisms. (1988). Report of the Presidential Task Force on Market Mechanisms.
- Federal Reserve History. Stock Market Crash of 1987.
From the series The Edge of Chaos.
Written with an LLM in the loop, like everything here. The ideas and the mistakes are mine. More on how I write.