Why the Calm Is Dangerous

So far the series has been about why crashes happen and why you cannot read them off their triggers. This one is about the rare practical payoff: the chance of seeing a break coming. A system heading for a tipping point often gives off warning signs, and the odd thing is where they hide. They hide in the calm, in a precise, measurable sense: the quietest system can be the one closest to breaking.
#I. A ball in a valley
Picture a ball resting at the bottom of a valley. That is a stable state. Nudge the ball and it rolls back down. The market is in its current mood, the lake is clear, the climate is where it has been, and small disturbances do not change that, because the valley holds the ball in place.
Now imagine the valley slowly getting shallower.
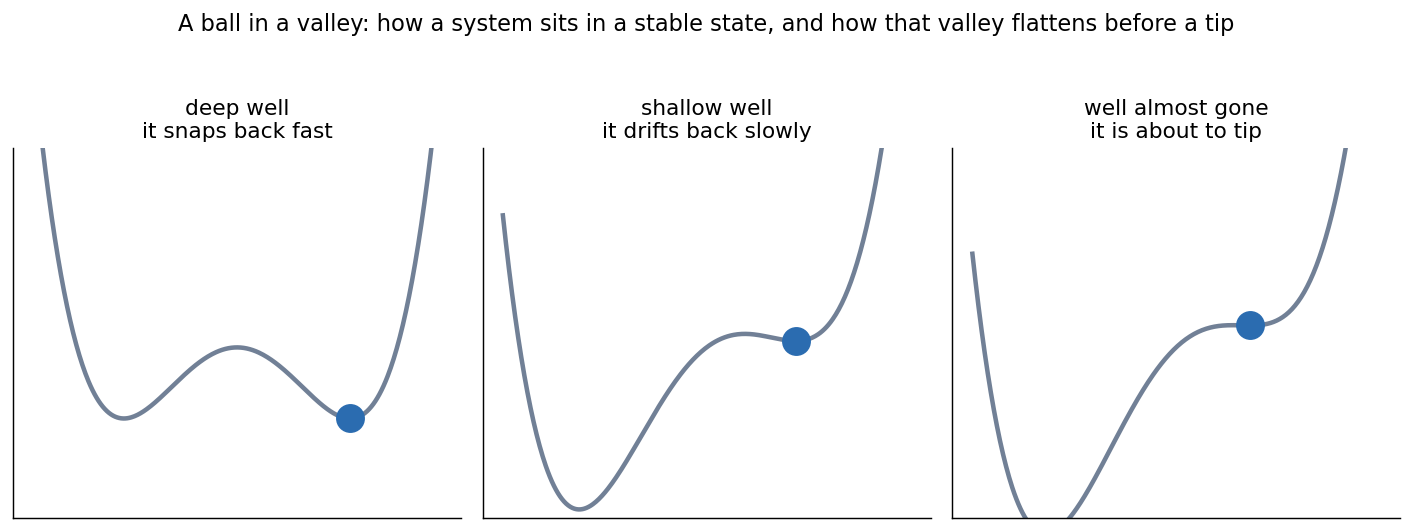
A stable state is a ball in a valley. Far from a tipping point the valley is deep and steep, so a nudged ball snaps back fast. As the system nears the tip, the valley flattens, the ball drifts back slowly and wanders far, and finally the valley gives way and the ball rolls off to another state.
That flattening is what approaching a tipping point looks like from the inside. The state is still stable, the ball still sits in a valley, but the walls that hold it there are weakening. And a system in a flattening valley behaves differently from one in a steep valley, in ways you can see without knowing anything about its inner workings.
#II. Two things you can measure
Before reading on, guess: the same random knocks hit a ball in a deep valley and a ball in a shallow one. What two differences would show up in a recording of each ball’s position?
Watch a ball in a deep valley. Knock it and it shoots back to the bottom. Watch a ball in a shallow valley. Knock it by the same amount and it eases back slowly, taking its time, and meanwhile the ordinary random jostling pushes it further from the bottom because nothing is pulling it back hard. Two things change as the valley flattens, and both show up in a plain time series.
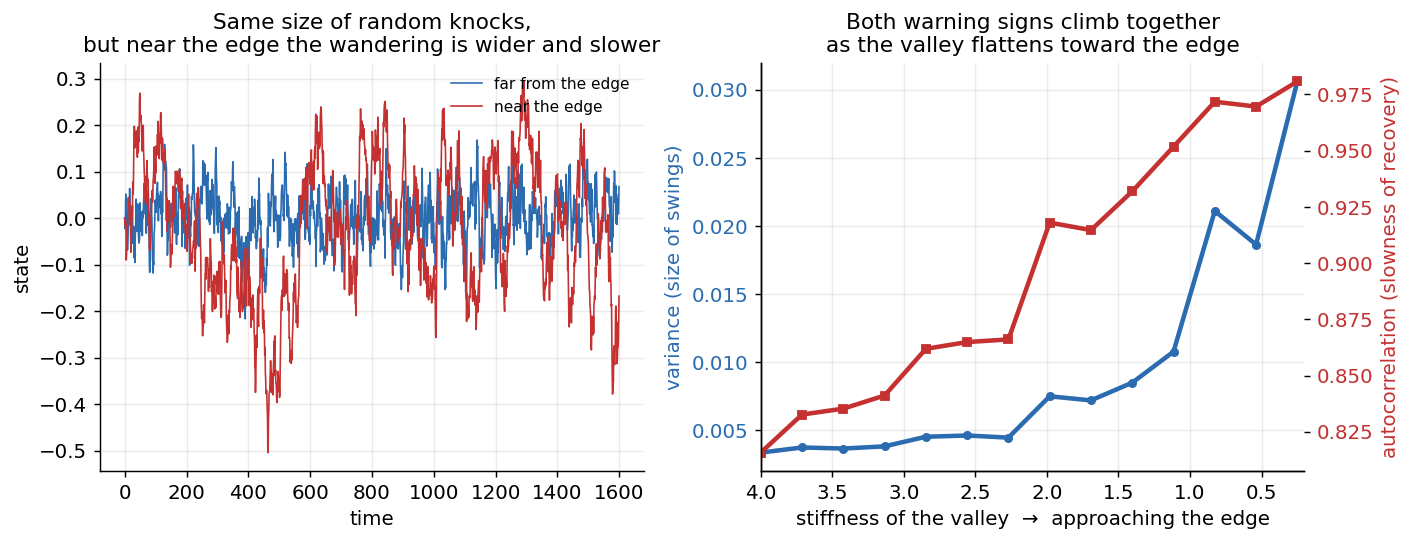
Left, the same size of random knocks produces tight quick wiggles far from the edge and wide slow wandering near it. Right, as the valley flattens, both the size of the swings (variance) and the sluggishness of recovery (autocorrelation) climb together.
The first is that recovery slows down. The system takes longer to shrug off a disturbance, so each moment looks more like the one just before it. Statisticians measure that as rising autocorrelation. The second is that the swings get wider, measured as rising variance. Slower recovery and wider swings, arriving together, are the fingerprint of a system approaching a transition. The whole effect has a name: critical slowing down.
The reason this is useful is that you can detect it from the outside. You do not need a model of the lake or the market or the climate. You watch the wandering, and if recovery is slowing and swings are widening, the valley is flattening, whatever the valley is made of.
The toy below keeps the shocks the same and changes only the valley. As the valley flattens, the line wanders further and remembers its last position longer.
#III. Lakes, climate, and the body
This did not begin as a market idea. It came from ecology, and the leading figure is Marten Scheffer.
Shallow lakes have two states. Clear water with plants on the bottom, and green water choked with algae. A lake can flip from one to the other quite suddenly when nutrients build up past a threshold, and the flip is hard to reverse once it happens. Scheffer and his colleagues showed that the flip is announced in advance. In the months before a lake tips, it recovers more slowly from disturbances and its measurements grow more autocorrelated and more variable, exactly the signature above.
The striking thing is how far the same signature travels. Scheffer’s group and others have found critical slowing down ahead of shifts in regional climate, ahead of collapses in fish and wildlife populations, and even ahead of transitions in the body, where the warning shows up in breathing before an asthma attack or in brain activity before an epileptic seizure. Different machinery, the same statistical tell. This is the universality from the first essay doing its work once more. Near a tipping point the details fall away and only the slowing-down remains, which is exactly why a method built for lakes can be pointed at a market.
#IV. The calm that builds the storm
Point it at markets and two readings emerge, and they seem to contradict each other until you separate the timescales.
The first is the direct one. Before some financial crises, you can find the early-warning signature in the data: correlations across assets rising, prices mean-reverting more slowly, swings widening during the quiet stretch before the break. The valley is flattening, and the flattening is visible in the calm.
The second comes from economics, and it is older. Hyman Minsky’s phrase was that stability is destabilizing. A long calm makes people confident, and confident people take on leverage and risk precisely because nothing has gone wrong lately. That quiet accumulation of leverage is what carries the system toward its edge. The calm helps build the storm.
You can watch both readings at once in the volatility blow-up of early 2018. Through 2017 American stocks were about as calm as they have ever been, with the VIX, the market’s fear gauge, grinding down to record lows near nine and staying there for months. That stillness pulled enormous sums into bets that it would continue, the popular ones being products that pay off a little each quiet day and short volatility to do it. That is the Minsky clock: the calm itself built a tower of crowded, leveraged positions all wagering on more calm. Then on February 5, 2018 a roughly four percent drop in stocks, sharp but hardly historic, more than doubled the VIX in a single session. The crowded short-volatility bets detonated, one widely held inverse-volatility note lost about nine-tenths of its value overnight and was wound down within days, and the unwind fed back into the market it was supposed to be hedging. A modest grain, a pile loaded to the brink, a cascade.
These look opposed only if you forget there are two clocks. On the slow clock, a long calm builds fragility, in Minsky’s sense, by lulling everyone into loading up. On the fast clock, right as the system approaches its tipping point, the calm turns subtly twitchy, recovery slowing and swings widening, in Scheffer’s sense. The long quiet loads the system; the late, strange quiet signals that it is nearly done loading. Both say the same uncomfortable thing: calm is often where the risk is quietly being made.
#V. How much to trust it
Do not oversell this, because the same fragility that haunts the rest of the series haunts the warning signs too. They are noisy. They cry wolf, flagging transitions that never come. They are frequently clean only in hindsight, once you already know where the crash was and went looking for the run-up. And measuring how close a system sits to its tipping point is the same unstable, sample-hungry estimate that the next essay is entirely about.
So treat critical slowing down as a yellow light, not a clock. It does not give you the hour the ground gives way, only that the ground is getting soft. That is still worth a great deal, because the instinct it corrects is the dangerous one: reading a long quiet as safety. The calmest market, the one where everyone agrees and nothing seems to move, is exactly the one whose valley may be flattening under it.
Which leaves the question this series has been circling from the start. Every method here depends on one number, how close the system is to its edge, and that number is the hardest thing in the world to measure on a fat-tailed system. The next essay is about why, and about the man who built a career insisting on it.
#Further reading
Critical slowing down and early-warning signals:
- Scheffer, M., Bascompte, J., Brock, W. A., et al. (2009). Early-warning Signals for Critical Transitions. Nature, 461.
- Scheffer, M., Carpenter, S. R., Lenton, T. M., et al. (2012). Anticipating Critical Transitions. Science, 338(6105).
Whether markets actually show it before a crash:
- Diks, C., Hommes, C., and Wang, J. (2019). Critical Slowing Down as an Early Warning Signal for Financial Crises?. Empirical Economics, 57(4).
- Guttal, V., Raghavendra, S., Goel, N., and Hoarau, Q. (2016). Lack of Critical Slowing Down Suggests that Financial Meltdowns Are Not Critical Transitions, yet Rising Variability Could Signal Systemic Risk. PLOS ONE, 11(1).
Stability that breeds instability:
- Minsky, H. P. (1992). The Financial Instability Hypothesis. Levy Economics Institute, Working Paper No. 74.
The 2018 short-volatility break:
- Credit Suisse AG. (2018). Credit Suisse AG Announces that The Nasdaq Stock Market Intends to Suspend Trading of the XIV ETNs Following the Market Close on February 15, 2018 and Institute Delisting Proceedings.
- U.S. SEC. (2021). In the Matter of S&P Dow Jones Indices LLC. Securities Act Release No. 10943.
Written with an LLM in the loop, like everything here. The ideas and the mistakes are mine. More on how I write.