Reflexivity by the Numbers

Three essays in, the same idea keeps surfacing in different words: markets react to themselves. Prices move because prices moved, and the big moves arrive with no outside cause. George Soros built a whole investing philosophy on this and gave it a name, reflexivity. Markets, he said, act on their own reflection, and that reflection feeds back into the world.
It is a good story, and the trouble with a good story is that it explains everything and predicts nothing until someone turns it into a number. This essay is about the number: how much of what a market does is the market answering itself, and how much is it answering real news from outside. You can actually measure that, and the tool comes from an unlikely place, the study of earthquakes.
#I. Aftershocks
After a big earthquake come aftershocks. The first quake changes the stress in the rock around it, which makes more quakes more likely, which change the stress again. One event breeds others. Seismologists needed a way to describe events that trigger their own offspring, and in 1971 a statistician named Alan Hawkes wrote down the math for it.
The idea is simple enough to say in a sentence. Normally events arrive at some steady background rate. In a Hawkes process, every event that happens temporarily raises the chance of the next one, and that bump fades over time. Each arrival is a little spark that makes more sparks briefly more likely. Quakes have aftershocks. Emails trigger replies that trigger more emails. And trades, it turns out, trigger trades.
Compare what that looks like to events that genuinely do not talk to each other.
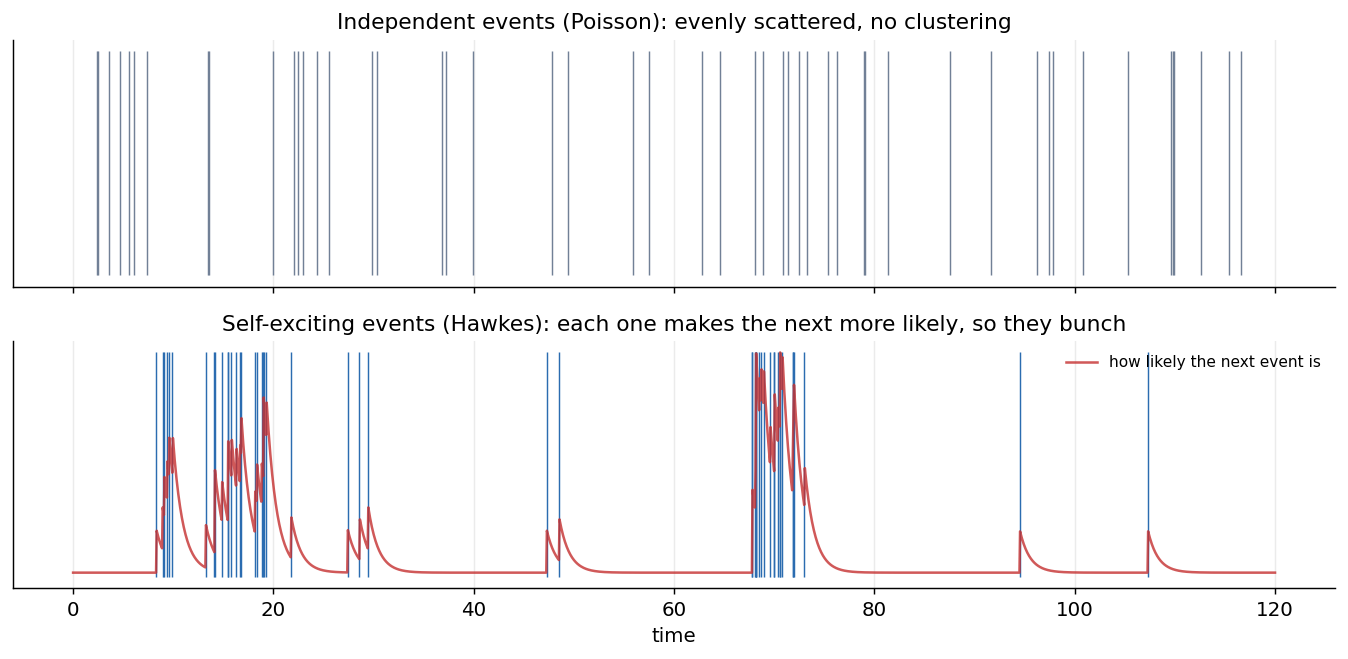
Top, independent events: scattered evenly, no memory. Bottom, self-exciting events: each one lifts the chance of the next, so they arrive in bursts. The red line is that rising and falling chance. Markets look like the bottom panel, not the top.
The bottom panel is what real market activity looks like, and it has a familiar name on trading desks: volatility clustering. Calm begets calm and turbulence begets turbulence, not because the news arrives in clusters but because each move provokes the next. That clustering is the visible fingerprint of a market exciting itself.
Run the branching version yourself. One outside spark arrives first; every event it triggers can trigger more. Slide the branching ratio toward one and watch the families stretch out.
#II. The one number
Hawkes processes come with a single number that measures exactly what Soros was hand-waving at. It is called the branching ratio, written $n$, and it answers one question: on average, how many further events does each event directly trigger?
If $n$ is small, a spark fizzles. One event triggers a fraction of an event, which triggers a smaller fraction, and the chain dies almost at once. If $n$ is close to one, a spark nearly sustains itself: each event triggers almost a full event in turn, the chain runs long, and the system hangs on the edge of a runaway. At $n$ equal to one, a single event sets off a chain that, on average, never ends.
Guess first: at $n = 0.9$, how many events does one outside spark ultimately cause, counting the whole family of descendants?
There is a clean formula for how big a chain one trigger sets off, counting all its descendants: the average family size is $1/(1-n)$. The closer $n$ creeps to one, the more violently that blows up.
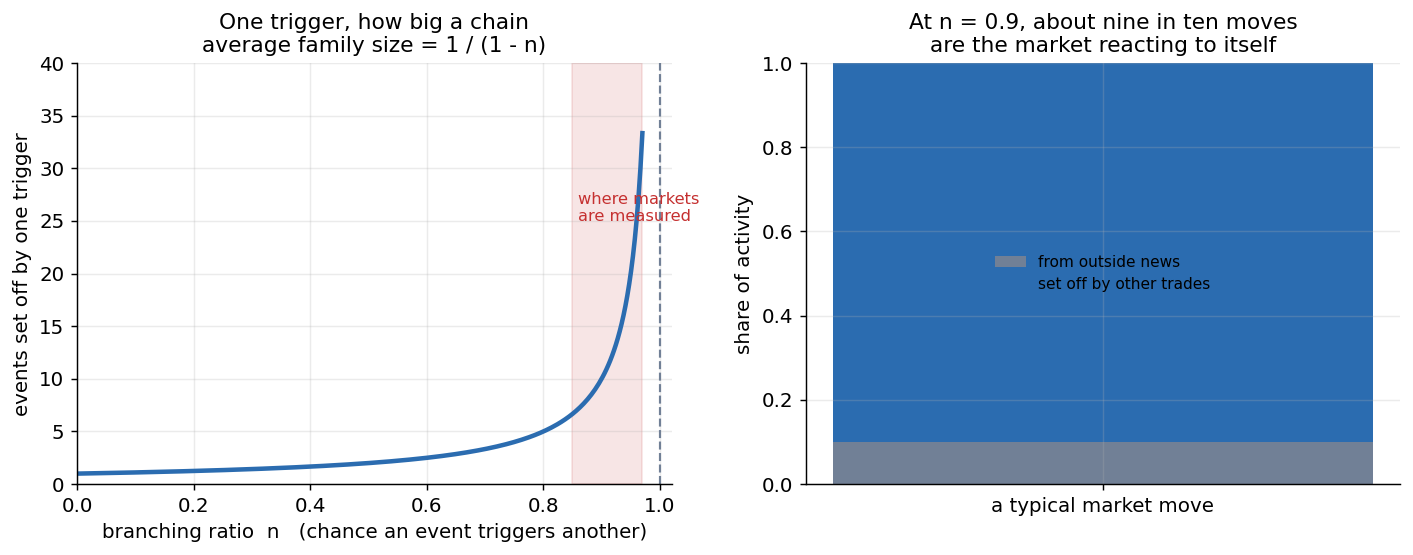
Left, one trigger’s total chain, 1/(1-n), exploding as n approaches one. Right, what the measurements imply: at a branching ratio around nine-tenths, most of what a market does is the market reacting to itself.
So the vague idea has become a dial. Turn $n$ from zero to one and you move a market from “mostly responding to the outside world” to “mostly talking to itself, one spark from a runaway.”
#III. What the dial reads
Two groups measured it, both fitting Hawkes processes to high-frequency futures data, and the answer is the interesting part.
Vladimir Filimonov and Didier Sornette, working with E-mini S&P 500 futures, found the branching ratio high and climbing over time, with the share of activity driven by genuine outside news falling from roughly a third in the late 1990s to well under that by the late 2000s. Their reading: markets have become steadily more reflexive as trading automated, and the rising endogeneity is a warning sign, a system drifting toward the runaway point.
Stephen Hardiman, Nicolas Bercot, and Jean-Philippe Bouchaud reanalyzed the same kind of data and pushed back on the trend while agreeing on the level. Their estimate put the branching ratio even closer to one, near 0.9 and above, and roughly stable from 1998 to 2011 rather than climbing. Their reading: markets are not drifting toward criticality, they have been sitting right next to it the whole time.
Notice that the two groups disagree about the trend and agree about the headline. Whether it is rising or steady, the number is high. Something like nine in ten of the events that move a market are the market responding to its own activity, not to news from the world. The outside, the actual information about companies and economies that prices are supposed to be tracking, accounts for a small slice. The rest is the echo.
#IV. Why this matters
This is the measurement under everything the earlier essays asserted. When the first essay said markets sit near a critical point, this is the evidence: a branching ratio next to one is what near-critical self-excitation looks like in trade data. When the second said markets are sandpiles that self-organize to the edge, this is the slope, measured. When the third described bubbles as runaway feedback, this is the feedback, quantified.
It also explains the strangest market events of all, the flash crashes, where prices collapse and recover in minutes with no news to speak of. May 6, 2010 is the cleanest case. By the SEC and CFTC’s joint account, a single fund began selling 75,000 E-mini S&P 500 futures contracts, about 4.1 billion dollars worth, through an algorithm instructed to keep pace with 9 percent of trading volume and to ignore price and time. In a market primed to amplify, each execution triggered the next, the Dow fell roughly 998 points, about 9 percent, in minutes, and then recovered most of it within the half hour. No news arrived to justify any of it. That is an avalanche in a market loaded to the brink, the Hawkes picture playing out in real time: one ordinary sell program whose descendants ran away.
#V. The catch
Be careful about how hard to lean on the exact number, because the disagreement between the two groups is not noise. It comes from choices in the model: how you assume the triggering fades over time, what window you fit, how you handle the fastest timescales. Change those and the branching ratio moves, which is why one careful group reads a rising trend and another reads a flat line from the same kind of data.
That should make you suspicious in a specific way. The branching ratio is telling us the market sits close to a critical point, and “close to a critical point” is precisely where every estimate becomes unstable and sample-hungry. The tool says the system is near the edge, and being near the edge is what makes the tool’s own reading shaky. We have measured that the market is reflexive, and the measurement inherits the fragility of the thing it measured.
That tension runs straight into the rest of the series. The next essay asks how hard flows move prices once the chain reaction starts. Then we ask what the quiet stretches can tell you before a cascade, and finally press the hardest question of all: if the number you most want, how close the market is to its edge, is the number you can least trust, what is left to do?
#Further reading
Where the idea comes from:
- Soros, G. (2013). Fallibility, Reflexivity, and the Human Uncertainty Principle. Journal of Economic Methodology, 20(4).
The self-exciting model and its use in markets:
- Hawkes, A. G. (1971). Spectra of Some Self-Exciting and Mutually Exciting Point Processes. Biometrika, 58(1).
- Bacry, E., Mastromatteo, I., and Muzy, J.-F. (2015). Hawkes Processes in Finance. Market Microstructure and Liquidity, 1(1).
Measuring how reflexive markets are:
- Filimonov, V., and Sornette, D. (2012). Quantifying Reflexivity in Financial Markets: Toward a Prediction of Flash Crashes. Physical Review E, 85.
- Hardiman, S. J., Bercot, N., and Bouchaud, J.-P. (2013). Critical Reflexivity in Financial Markets: a Hawkes Process Analysis. European Physical Journal B, 86.
The 2010 Flash Crash:
- U.S. SEC and CFTC (2010). Findings Regarding the Market Events of May 6, 2010.
- Kirilenko, A., Kyle, A. S., Samadi, M., and Tuzun, T. (2017). The Flash Crash: High-Frequency Trading in an Electronic Market. Journal of Finance, 72(3). The academic anatomy of the cascade.
Written with an LLM in the loop, like everything here. The ideas and the mistakes are mine. More on how I write.