The Limits of Knowing

Six essays in, we have a toolkit. Bouchaud’s branching ratio, Sornette’s critical time, Gabaix and Koijen’s flow multiplier, Scheffer’s slowing-down: different instruments, all pointed at the same condition, a system loaded near its edge. This essay is about the catch that has been sitting in the room the whole time. That condition, the distance to the edge, is the single hardest thing to pin down on exactly the kind of system where it matters most. Nassim Taleb built a career on this objection, and it is the strongest case against everything that came before.
#I. Where counting stops working
Most of statistics rests on a quiet promise: collect enough data and the average settles down to the truth. Flip a coin a thousand times and the fraction of heads sits near one half. Measure a thousand people and the average height barely moves when you add the next. This is the law of large numbers, and in a thin-tailed world it works beautifully.
Guess first: keep adding fat-tailed observations and watch the running average. Does it settle the way an average of heights does?
In a fat-tailed world it barely works at all.
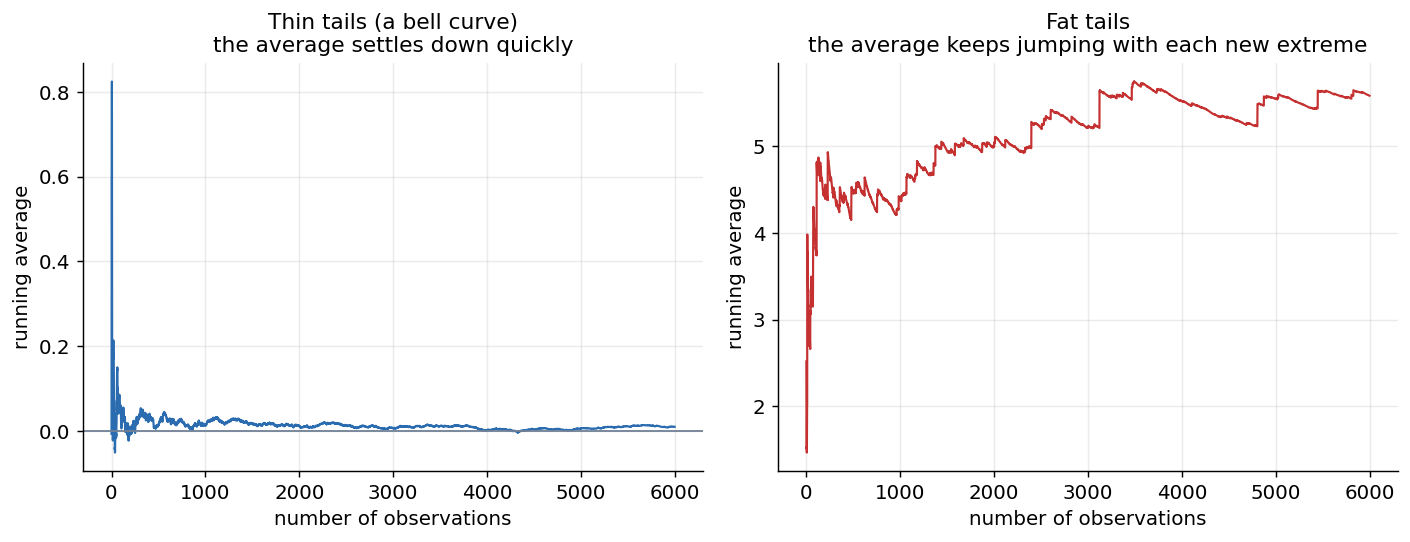
Left, with thin tails the average settles fast, so a modest sample tells you the truth. Right, with fat tails the average keeps jumping with each new extreme and never settles, so no sample you will ever collect pins it down.
Look at the right panel. When the tail is heavy enough, the running average barely settles. It sits flat for a while, then a single huge observation arrives and yanks it upward, and for the fattest tails this repeats without end. The sample is dominated by its largest member, and the largest member keeps being beaten. For a fat-tailed quantity, the thing you most want to know, the size of the typical large event, is the thing your data refuses to reveal, because the data is always one big surprise away from rewriting it.
Taleb’s word for this is preasymptotics. The textbook results are about what happens with infinite data. With the finite data you actually have, a fat-tailed world is a place where the worst event so far is never a good estimate of the worst possible, where the mean can be undefined or, when it exists, converge painfully slowly, and where the next observation can dominate everything before it. The tail is where all the risk lives, and the tail is precisely the region you can never sample enough of.
#II. Honesty makes it worse
Now suppose you set that aside and insist the world is thin-tailed after all. You fit a nice bell curve. Even then there is a trap, and it is subtle.
You never know the bell curve’s width exactly. You estimate it from data, and that estimate has error. And the error has its own error, because your method of estimating is itself uncertain, and so on. Taleb and Pasquale Cirillo showed what taking that seriously does. It fattens the tail.
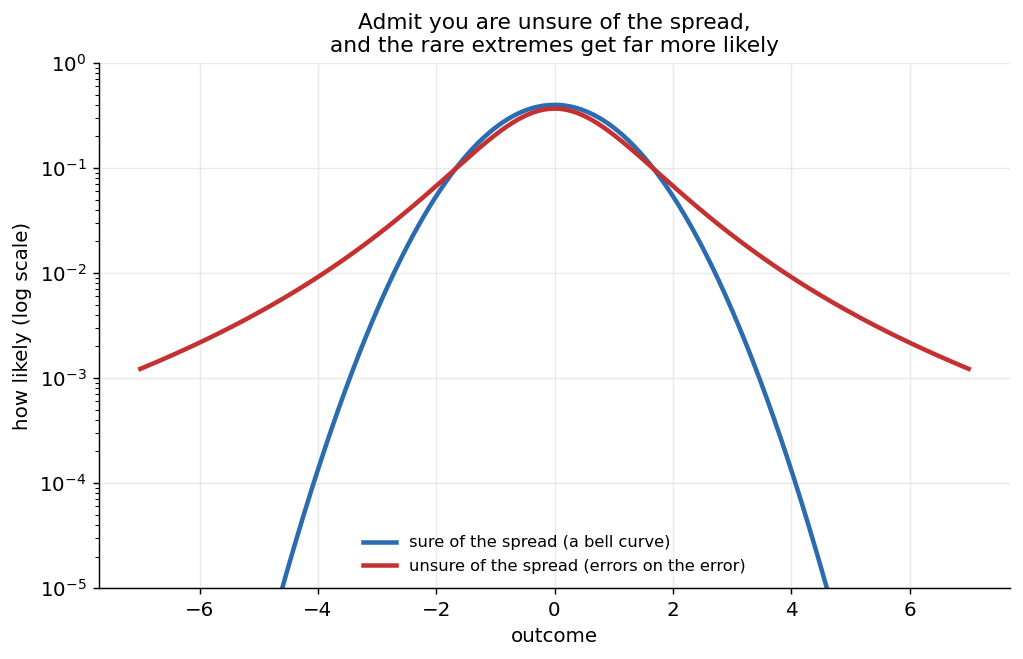
Start with a bell curve and admit you are unsure of its width. Average over that uncertainty and the result has heavy tails: the rare extremes become far more likely. Being honest about not knowing the parameter turns a thin tail into a fat one.
The mechanism is clean once you see it. Some of the time the true spread is larger than your best guess, and those wide cases throw out extremes far more often than the narrow cases suppress them, because the extremes scale up faster than they scale down. Mix over your uncertainty and the blend is heavy-tailed even though every ingredient was a bell curve. Taleb and Cirillo call the consequence the forecasting paradox: the distribution you should use to predict is heavier-tailed than the one you fit to the past, so the future is structurally more extreme than the data you trained on. Thin-tailed certainty is unreachable from the inside, because honest uncertainty manufactures fat tails on its own.
#III. What this does to the whole series
Hold this up against the previous five essays and it cuts deep.
Sornette’s critical time is estimated by fitting a shape to a price run. Bouchaud’s branching ratio is estimated by fitting a self-exciting process to trades, and we already saw two careful groups disagree on whether it rises or holds steady. Scheffer’s warning signs are estimated from the variance and autocorrelation of a noisy series. Every one of them is an estimate of how close a system sits to its critical point, and the critical point is exactly where estimates become unstable and sample-hungry, on data that is fat-tailed in the first place. The tools tell you the system is near the edge, and being near the edge is what makes the tools’ own readings shaky. Taleb’s claim, put plainly, is that the number these methods chase is the number their own setting forbids you from trusting.
There is a worthy opponent here, and it is not Sornette. It is Paul Embrechts, the dean of extreme value theory, whose whole discipline is the rigorous estimation of tails: fit the right curve to the exceedances, estimate the tail index, extrapolate past your largest data point in a principled way. To Embrechts, the tail is hard but tractable, and Taleb’s pessimism throws away a working toolkit. Taleb’s reply is that extreme value theory relocates the problem rather than solving it: now you must estimate the tail index from the few points in the tail, and that estimate is itself unstable and threshold-dependent, which is the errors-on-errors problem wearing a lab coat. That argument is unresolved, and probably unresolvable, because settling it would take exactly the abundant tail data whose absence is the whole point.
Drag the threshold in the toy below. The Hill estimate uses fewer points as it moves deeper into the tail, and the same sample can wander across very different risk worlds. The estimator is doing exactly what it is supposed to do; the data are what refuse to sit still.
Long-Term Capital Management is the monument to all this. The fund was run by some of the most capable people in the field, including Myron Scholes and Robert Merton, who had just shared the 1997 Nobel for the mathematics of options. Its models were calibrated on years of data in which the trades it favored had reliably converged. In 1998, after Russia defaulted on its debt, they stopped converging all at once. The fund lost more than half its capital in a matter of weeks, and the Federal Reserve had to organize a 3.6 billion dollar rescue by fourteen banks to keep the unwinding from dragging the system down with it. The models were not sloppy. They were fit to a past that did not contain the event that killed them, which is the preasymptotic trap with a body count.
#IV. So what do you actually do
You might expect all this to end in a shrug: nothing can be known, so nothing can be done. It does not. You do not have to measure how close the edge is to keep your distance from it, and that gap is where Taleb’s practical advice lives.
If you cannot know the probability of the tail, stop trying to forecast it and change your exposure instead. Carry redundancy and slack, the very things the efficiency essay said get optimized away. Cut leverage and tight coupling, because they are what turn a local shock into a cascade. Hold cheap insurance against the moves you cannot rule out, and buy it when it is cheap, which is during the calm. Prefer positions that lose a little if you are wrong and gain a lot if the rare event lands, rather than the reverse. None of this requires knowing when, or how close to the edge, or which grain triggers the slide. It only requires believing that the edge is real and probably nearer than it looks.
That is the personal resolution. The diagnostics from the earlier essays are not crystal balls and should not be traded as if they were. They are regime detectors, and their honest job is qualitative: to tell you when a market has stopped being an ordinary thin-tailed place and has loaded itself near its critical edge. Sornette’s accelerating climb, Bouchaud’s branching ratio near one, Scheffer’s slowing recovery, all of them are ways of noticing the same condition. And once you have noticed it, you do not try to forecast the crash. You step out of where it would land.
Blake painted Newton at the bottom of the sea, so absorbed in the diagram under his compass that he never turns to see the dark rock behind him. The figures in this series, Bouchaud, Sornette, Scheffer, are doing real and beautiful work with the compass. Taleb is the one tapping the shoulder, pointing at the dark. You want both. Measure what you can, and build for what you cannot. The final essay turns that same lesson from the individual portfolio to the financial system itself.
#Further reading
The statistics of fat tails:
- Taleb, N. N. (2020). Statistical Consequences of Fat Tails. STEM Academic Press.
- Embrechts, P., Klüppelberg, C., and Mikosch, T. (1997). Modelling Extremal Events for Insurance and Finance. Springer.
- Hill, B. M. (1975). A Simple General Approach to Inference About the Tail of a Distribution. Annals of Statistics, 3(5). The tail-index estimator behind the simulation above.
Errors on errors and the forecasting paradox:
- Taleb, N. N., and Cirillo, P. (2019). Branching Epistemic Uncertainty and Thickness of Tails. arXiv:1912.00277.
- Taleb, N. N., and Cirillo, P. (2025). The Regress of Uncertainty and the Forecasting Paradox. Risks, 13(12).
When a fitted model met its tail:
- Federal Reserve History. Near Failure of Long-Term Capital Management.
Written with an LLM in the loop, like everything here. The ideas and the mistakes are mine. More on how I write.